![]()
The stock market crash of 1929 - charts and videos |
|
OLD VERSION OF THIS PAGE, THE NEW VERSION IS HERE
Many similarities between the corona crash and the 1929 crashes can be observed. Note the corona virus is the excuse or catalyst, how this market responded to a rate cut dictates that there is a bearish mood in the air. ( March 2020 )
Prior to crash
1. Easy credit makes everyone rich (See video 1) 2. Too many people are already long of property and stocks. (Nobody left to buy) 3. High leveraging is available to people, even those with poor credit ratings. 4. The markets become dependent on credit to sustain themselves. 5. The markets make all time highs 1 year before the crash.
During the crash
1. The inevitable domino effect sweeps through the market causing a succession of margin calls. 2. People try to sell, but there are no buyers. (See video2) 3. Markets go into nosedive 4. Regulators try to stem the declines but succeed only in making things worse. (See video3) 5. Regulators clamp down on short selling, and blame speculators for declines. (See video5) 6. Bank runs cause panic withdrawals from banks 7. People rush to buy gold
The aftermath....continued below videos
|
|
The crash of 1929 Part1 |
| The crash of 1929 Part 2 |
| The crash of 1929 Part 3 |
| The crash of 1929 Part 4 |
| The crash of 1929 Part 5 |
View 1929 chart, dates and scenarios |
 |
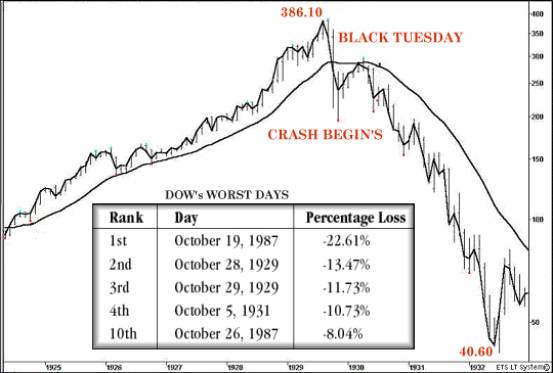 |
1929 data showing percentage declines and dates |
|
|
Hypothetical performance results have
many inherent limitations, some of which are described below. no
representation is being made that any account will or is likely to
achieve profits or losses similar to those shown; in fact, there are
frequently sharp differences between hypothetical performance results
and the actual results subsequently achieved by any particular trading
program. One of the limitations of hypothetical performance results is
that they are generally prepared with the benefit of hindsight. In
addition, hypothetical trading does not involve financial risk, and no
hypothetical trading record can completely account for the impact of
financial risk of actual trading. for example, the ability to withstand
losses or to adhere to a particular trading program in spite of trading
losses are material points which can also adversely affect actual
trading results. There are numerous other factors related to the markets
in general or to the implementation of any specific trading program
which cannot be fully accounted for in the preparation of hypothetical
performance results and all which can adversely affect trading results.
Futures, Forex and Stock trading contain substantial risk and are
not for every investor. An
investor could potentially lose all or more of the initial
investment. Risk
capital is money that can be lost without jeopardizing ones
financial security or lifestyle. Only
risk capital should be used for trading Only
those with sufficient risk capital should consider trading. Past
performance is not necessarily indicative of future results.
HYPOTHETICAL PERFORMANCE
DISCLOSURE
RISK
DISCLOSURE