![]()
| Articles & Videos & Calculators Product guide Trading IQ Game with great prizes Support - Home - Site Map - Testimonials |
| Demand Index ( DI ) |
� Roger Medcalf You may not reprint text or images without permission
REDIRECTING TO NEW PAGE
| Demand Index
was created by James Sibbet A detailed guide to the many methods of using Demand Index provided by Precision Trading Systems This product can be won by scoring well in my Trading IQ Game! |
|
Demand Index is the creation of James Sibbet, and uses complex code to make simple work of the interpretation of volume and price as a combination. Understanding volumes is never an easy task but this beautiful piece of programming certainly makes like a lot easier. There are several ways in which this indicator can benefit traders and investors to determine how markets will behave in the near future . Divergences Having studied many technical indicators over the years I have formed the opinion that Demand Index is one of best for finding meaningful divergences. If the price of the market is making a new high and the Demand Index is not this is known as a bearish divergence. There are several drastic photos below showing extreme cases of divergences to help you understand what to look for. Trend detection The crossing of the zero line is an indication of net selling or buying over the length you have specified, it must be noted that in this manner the indicator is acting as a lagging indicator and longer lengths are required with some smoothing to give meaningful results. Notwithstanding the above it is important to understand the difference between a "real crossing of zero" trend change move and a false signal. If Demand Index is hovering and fluctuating around zero it does not generally mean much, but a decisive break though which stands out is the kind of move that one needs to look for. Break outs When a range or tight congestion area can be seen in the Demand Index indicator it is well worth noting that when a break out from this range occurs, it will likely be followed by a break out in the same direction of the underlying market. As with the above it is also important to know the difference between noise and a real break out pattern, this must be an obvious observation and if you have to spend time asking yourself if it is real or not then it probably is not a good signal. Prediction of next movement When an extreme peak in Demand Index occurs it implies serious buying and this is usually followed by one more move up from the market. There is a photo lower down the page showing an example of this. Extended divergences over a period of time When a market continues to trend down and the Demand Index continues to trend up this is a sign of a major bottom forming and vice versa. |
|
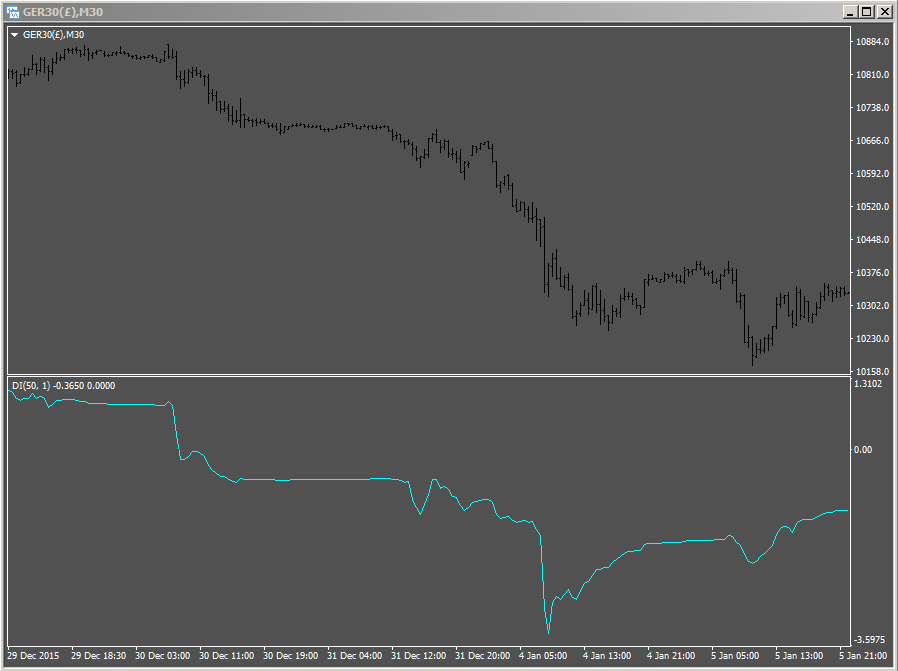
Demand Index length 50 for below signals a price dive as it crosses below zero Dax 30 ( 30 minute chart ) |
 |
|
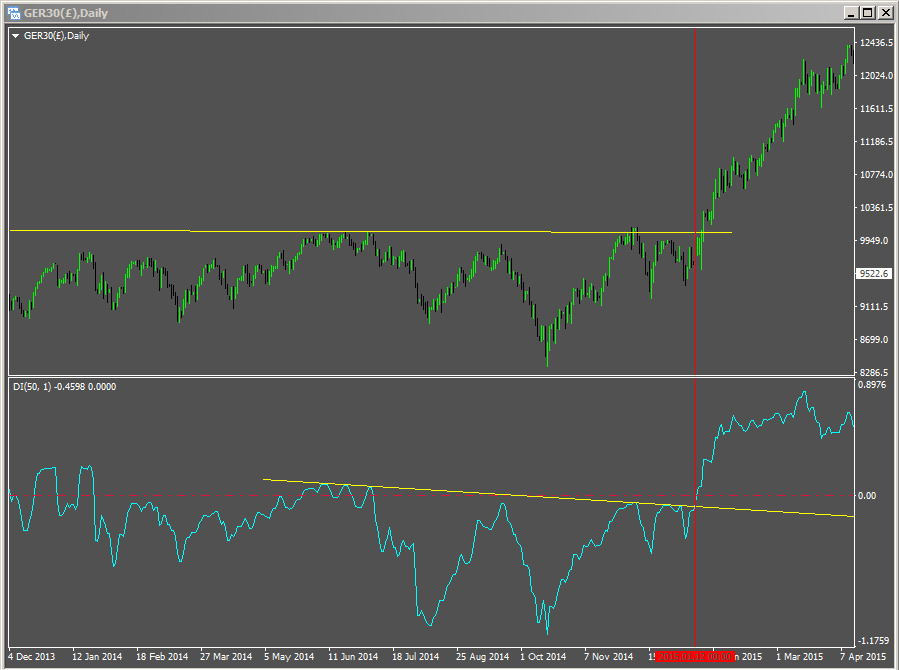
Demand Index length 50 below having a break out and crossing above zero just before the market moved up Daily chart Dax 30 This indicator often works better with longer lengths such as 30, 50 or 100 |
 |
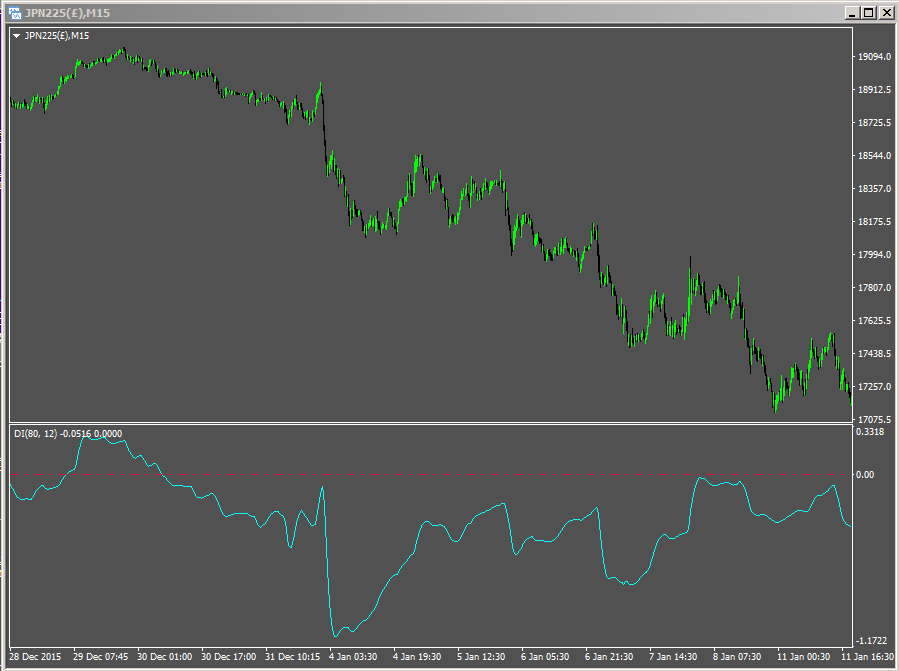
To make interpretation simpler a smoothing feature has been added to Demand Index Below length 80 with smoothing 12 shows the downtrend starting and stays below 0 as the price declines 15 minute chart of Nikkei 225
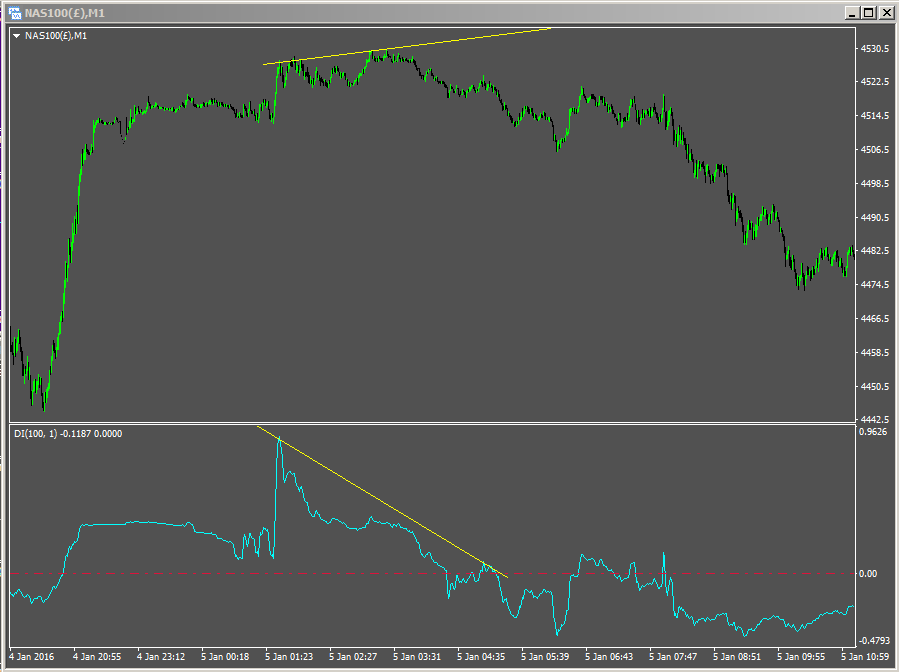
Demand Index length 100 below having a monster divergence with the price AND an extreme peak As stated above, the extreme peak signals a single higher peak is coming up The divergence thereafter calls it a bearish move ahead
Chart Nasdaq 100 on a 1 minute time frame |
 |
<<<<
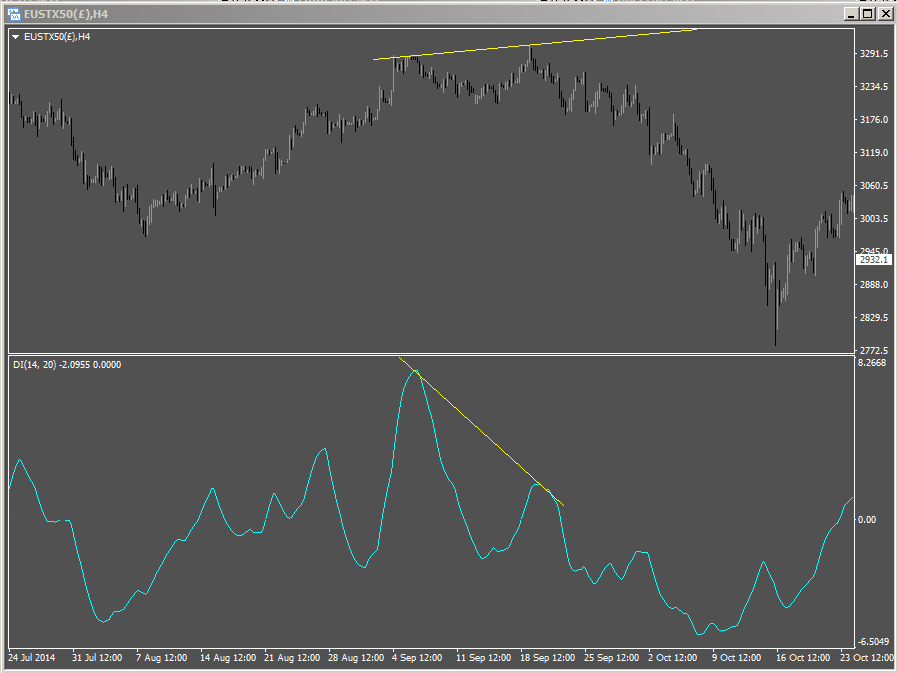
Demand Index length 14 with 20 smoothing below showing a big divergence which lead to a big drop in price ESTOXX 50 4 hour chart |
 |
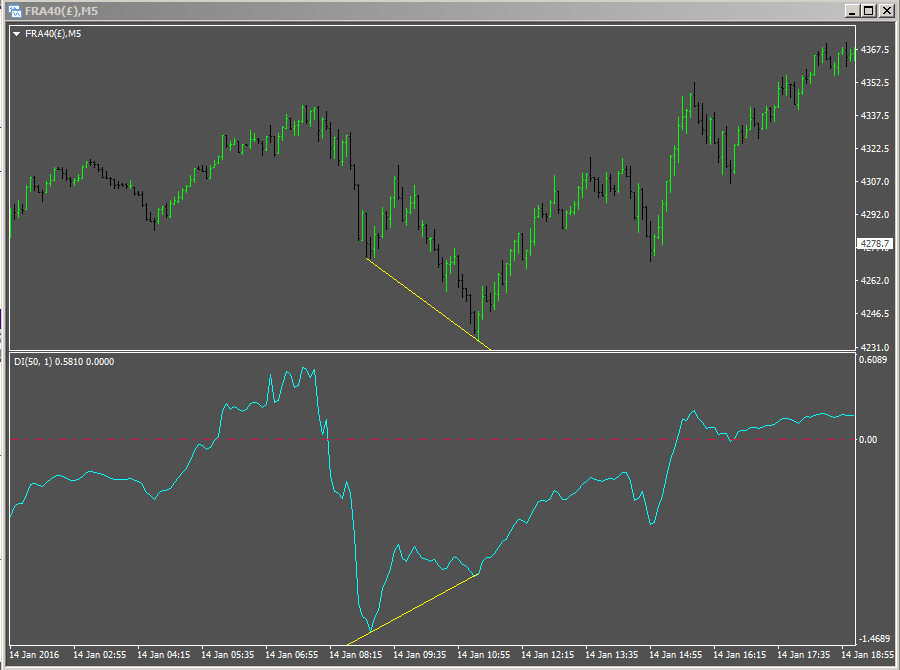
Below is an example of a bullish divergence with a lower low on the market price of a 5 minute chart of the French CAC 40 and a higher low on the Demand Index when looking at the same time. |
 |
|
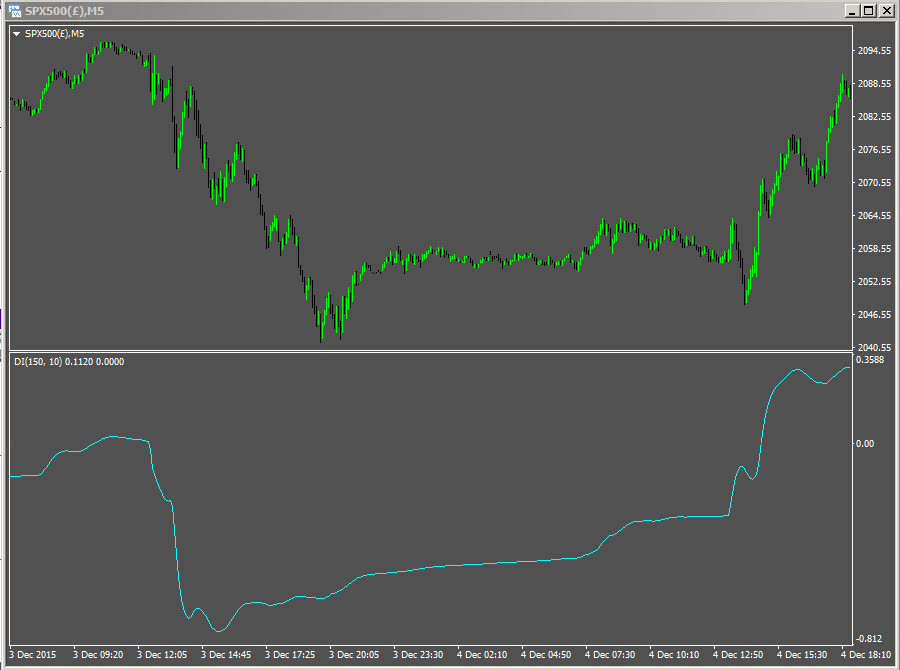
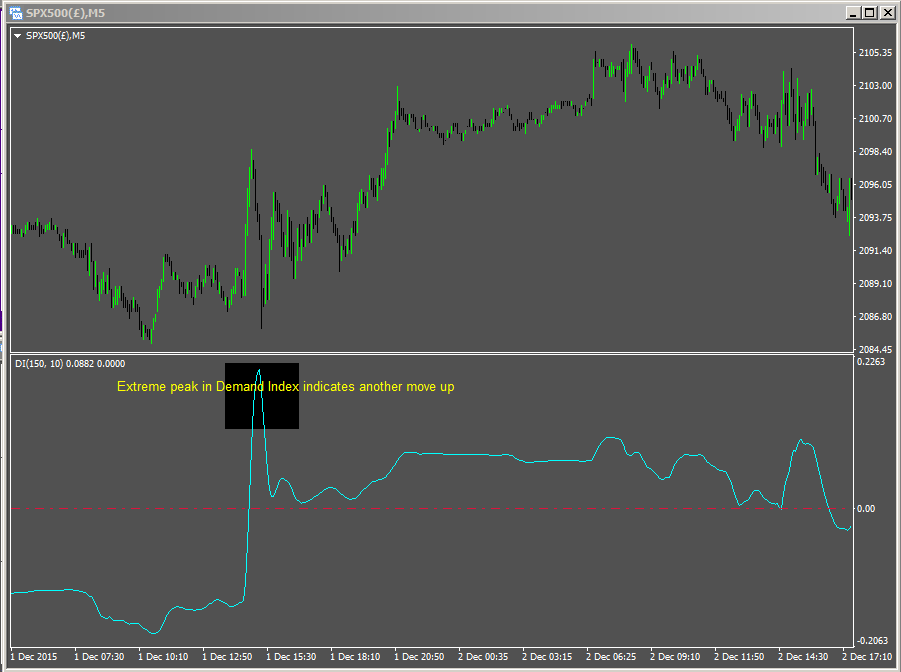
Another example of the future price direction
of the SP500 futures being predicted by Demand Index
Notice how well it correlates with what happened in the market, but
shows it BEFORE it happens.
One must not become deluded and expect this to predict the future, a
better outlook is to use the analogy of cloud examination.
How do we establish if it going to rain?
We look to see if there are clouds, if there are we look to see the
colour they are.
If the clouds are grey or black then we can reasonably expect a strong
probability of rain soon.
|
 |
|
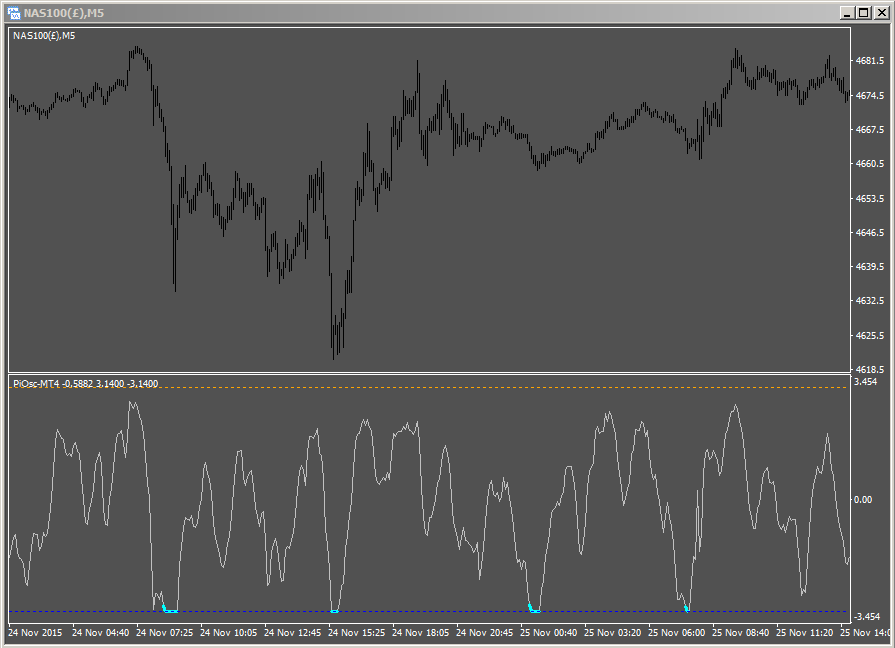
Below: Precision Index Oscillator designed to do all the hard work so you don't have to, Highlights are painted when its in position.
|
 |
|
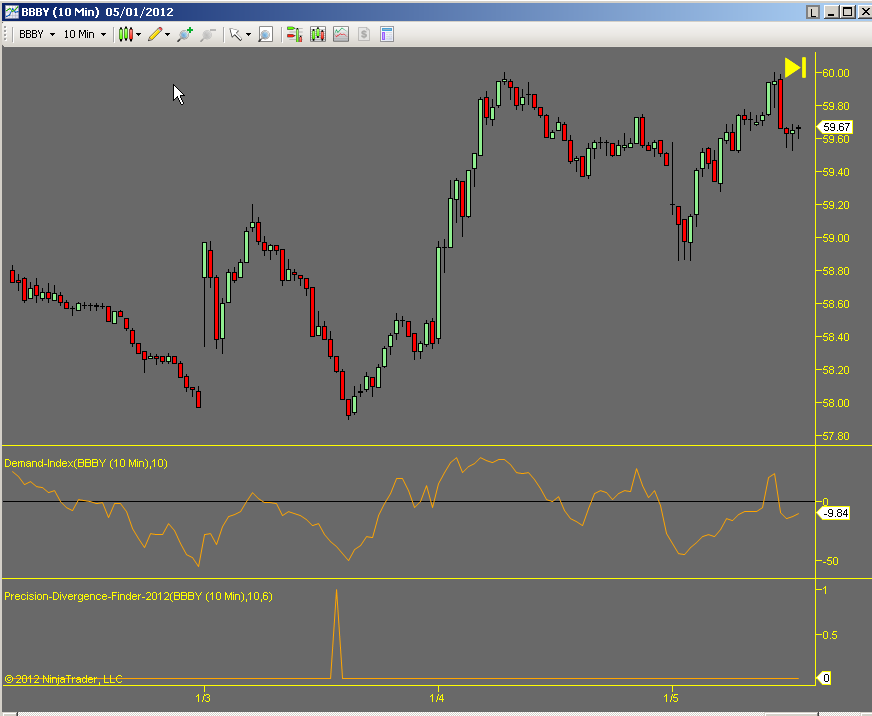
Below: Demand Index is also used in the Precision Divergence Finder 2012 which does the hard work in a very clear example. |
 |
Below: The extreme peak in Demand Index heralds a clear warning that prices will move higher soon. SP500 futures on a 5 minute chart. Then follows a new peak in the market, but the Demand Index does not make a new peak, indicating a bearish divergence is happening |
 |
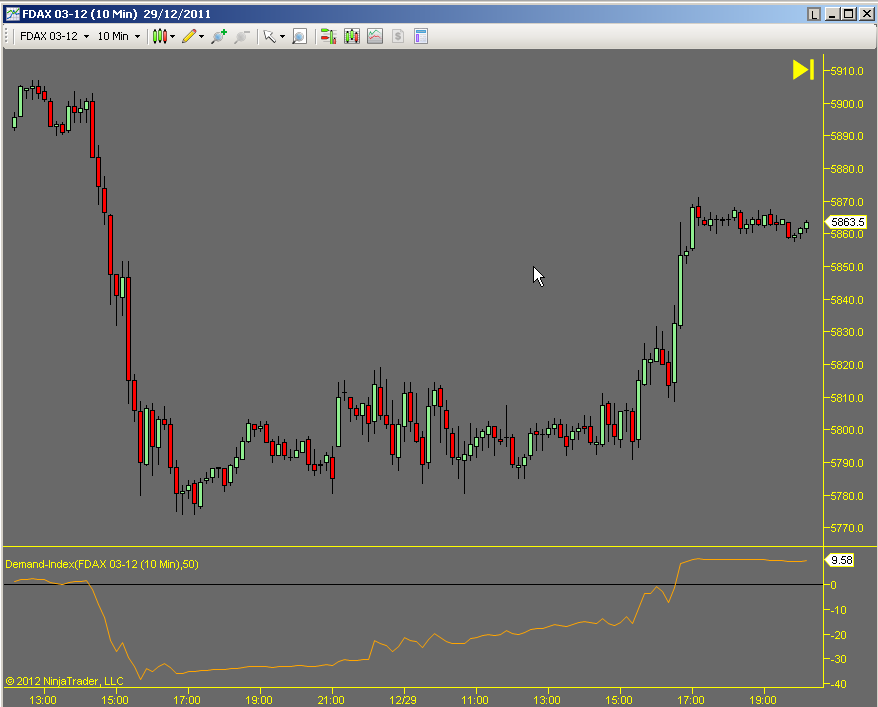
Below: The extreme dive in the Demand Index indicator shows a big move down is likely. The Dax Futures dropped by over 100 points shortly after this |
 |
|
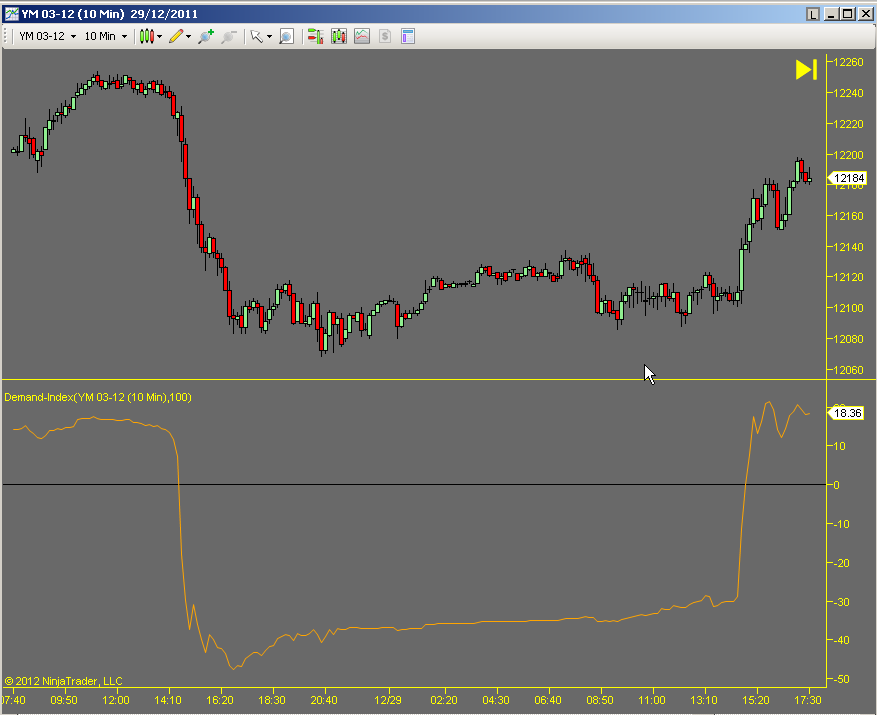
Below: Demand Index indicator crossing the
zero line gives a clear and reliable indicaton of up trend or down
trend. We can see the effect of increasing Demand Index length to 100. Notice the smoothed line give us clear trend definitions. The new low made at 20:00 was not confirmed by Demand Index low which is a bullish divergence. Notice also how after this the indicator just keeps rising showing us that volume accumulation is occurring. The minor sell off at 0850 does not transmit into the Demand Index as the volume was low. The move at the end of the data is backed up by a huge move up in the Demand Index Indicator, which illustrates the validity of it. |
 |
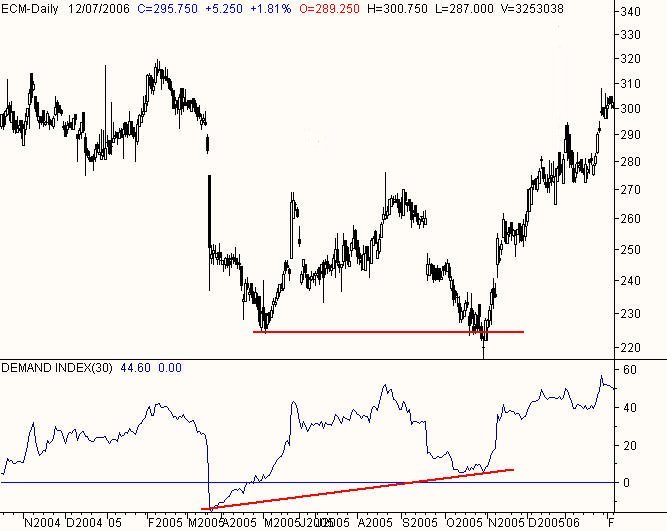
The photo below shows a simple and effective divergence in the Demand Index which led to a nice rally |
 |
|
Demand Index is available in four trading platforms
|
.
| Articles & Videos & Calculators Product guide Trading IQ Game with great prizes Support - Home - Site Map - Testimonials |
| RISK DISCLOSURE |
|
|
| HYPOTHETICAL PERFORMANCE DISCLOSURE |
|
Hypothetical performance results have many inherent limitations, some of which are described below. no representation is being made that any account will or is likely to achieve profits or losses similar to those shown; in fact, there are frequently sharp differences between hypothetical performance results and the actual results subsequently achieved by any particular trading program. One of the limitations of hypothetical performance results is that they are generally prepared with the benefit of hindsight. In addition, hypothetical trading does not involve financial risk, and no hypothetical trading record can completely account for the impact of financial risk of actual trading. for example, the ability to withstand losses or to adhere to a particular trading program in spite of trading losses are material points which can also adversely affect actual trading results. There are numerous other factors related to the markets in general or to the implementation of any specific trading program which cannot be fully accounted for in the preparation of hypothetical performance results and all which can adversely affect trading results.
|
Last updated
June 1 2023 re-directs to canonical DI page htp gone