![]()
| Articles & Videos & Calculators Product guide Trading IQ Game with great prizes Support - Home - Site Map - Testimonials |
|
How to trade. Part 2 A complete beginners guide to the concepts of trading |
|
The method of trade timing ( when to buy and when to sell )
If you think that experts traders always win, then I have to disabuse you of this myth. Expert traders lose regularly, but they win by cutting losses and letting profits grow and grow.
Just think on this for a moment. Cutting losses........Running profits. Let it sink into your mind deeply as these two little phrases are more valuable than gold and are one of the keys to success in trading. If you can't do it then you will never be a winning trader.
The method of trading I have found to be most profitable is known as Trend following. It is worth learning the theory.
|
|
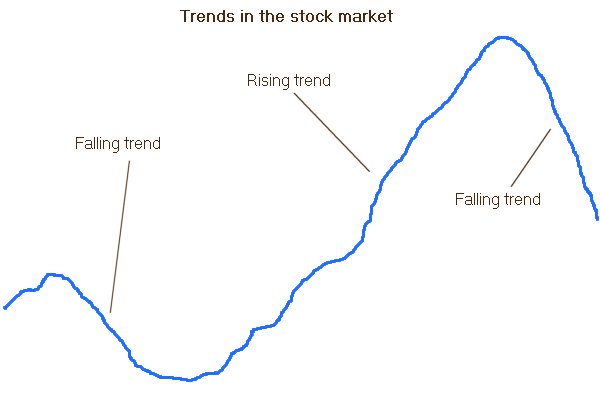
The wiggly line above is a very simplified example of the ebb and flow of stock market trends. Unfortunately the clarity of actual market trends is rarely as clear as the diagram above, if they were then trading would be many times easier than it is.
So imagine you are on the left side of the screen and you see the price falling ( turning into a down trend ) the correct action is place a short trade with a stop loss that trails to lock in profits and reduce risks. Once the trend begins rising the short position can be closed and a new long position is opened when you buy the market.
Key points to remember about trend following
You don't know how far the price will move up or down after you buy or sell
This is truthful reality, as those who claim to predict the future with any level of accuracy are deluded individuals. We can all make educated guesses and sometimes will get it right but sometimes we will get it wrong. So instead of buying at 100p and pre-deciding to sell at 110p the best approach is to observe there is a change in trend and follow it until it ends. The methods of trend detection will be covered later in this document.
You don't know if you will win or lose on each trade until it is closed.
Again it is a frequent occurrence that when we feel 100% sure that a trade will win, it will be the one that loses. Such is the reason why many traders lose everything on one big bet "a sure thing". We must hope for the best and be prepared for the worst. Thinking backwards is the key to this factor in the sense that the first thought that comes into the mind of a good trader will always be "how much can I lose on this trade" . This seems illogical as the beginner or novice will often see the other side of it and say to himself "This trade will make me thousands of pounds". The uncertainty of trading must be acknowledged and backed up by risk control.
You are trading in expectation of the trade making a big move and enter a long term trend phase.
This must be the expectation of the trend following trader or else it would not make any sense to place a trade. The reason for this is very simple, if he takes his profits too soon ( making small gains on winning trades ) then he will not have enough money to pay off the cost of losing trades. .
You will expect to have more losing trades than winning trades
Winning or losing on a trade ( with no commissions and costs ) is always going to be a 50-50 probability just like flipping a coins for heads and tails and once you factor into this the cost of dealing - data feeds - software - educational products - etc then you are left with more like a 47% - 49% chance of winning on any given trade. This at first sounds like a negative expectation bet, but it is only negative if you have equally sized winning and losing trades. To get a positive expectation trade or bet we need to make the winning trades bigger or the losing trades smaller or both. This is essence of successful trading
You will expect to have bigger winning trade than losing trades
This is based on the negative payout statistic above, and although it might be hard to believe, most pro traders only have 30-40% winning trades. As they run their profits and cut their losses they make the payout over the long run become a positive expectation. In some cases a good trader might have statistics where his winning trades are 2.5 to 3 times the size of his losing trades so his overall performance is going to be excellent.
|
|
How to identify a change in trend direction
As this is a beginners guide I will resist adding complexity to the types and just highlight the simplest ones.
Moving average change in direction ( If you don't know what a moving average is the please see the simple article here )
Trends in the stock market are usually very random and jerky, so to make life simpler for you to identify a trend change they often require some method of cleaning or filtering before they can be reduced to a simple "digital signal process" This might sound like a complex mouthful of words but it is really very simple and best shown in a graphic illustration.
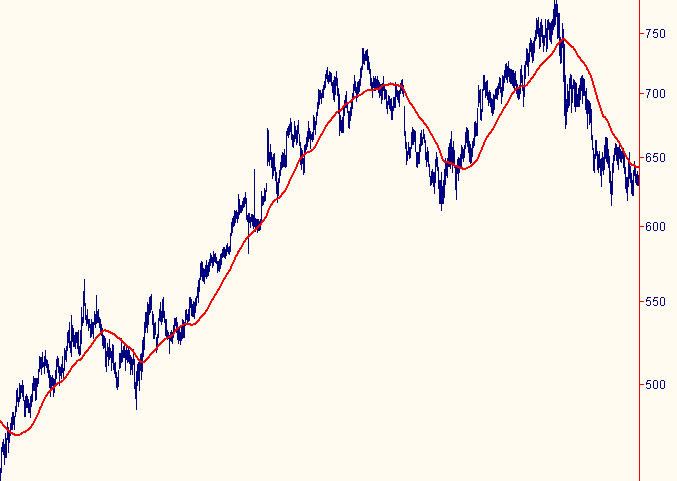
As you can see the price of the stock is volatile and chaotic, this makes trading decisions difficult for the beginner to interpret.
When a moving average is applied we have a very simple technique of measuring the direction of the trend.
If moving average is rising ( value is greater than it was on previous day ) we can define this as an uptrend
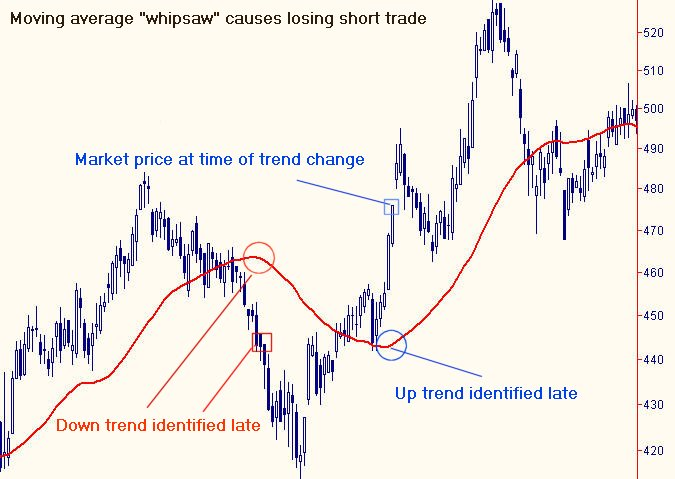
For this simplicity there is a price to pay and that price comes in the form of DELAY otherwise know as LAG in measuring of the trend changing direction. This can be a good thing but it can be a bad thing too. As moving averages can suffer from what is known as whipsaw, where they swing too late and signal an uptrend which is already reached the peak of its movement and immediately becomes a down trend.
In the diagram above you can see the effects of whipsaw. The trend change short signal at 445p was rather late in coming, and the trend soon changed into an uptrend which again was signalled late when the market price was already up to 475. This results in a loss of 30 points X your stake. At this point the reader need to be aware that moving average has many advantages AND disadvantages. These points will be covered in more depth in the intermediate sections.
Two moving averages crossing ( If you don't know what a moving average is the please see the simple article here )
In the diagram above you can see we are using two moving averages instead of one. The blue average is 9 periods ( which is known as the fast average ) and the red line is 25 periods which is known as the slow average. The points where the trend is defined as being up are when the fast average crosses over the blue average and is known as a golden cross. The down trend is defined when the fast average crosses below the slow average and is known as a dead cross. Generally moving average cross over systems use a fast average approximately 3-4 shorter in length than the slow one. The example above looks more impressive than the single moving average example but the reader must not draw any false conclusions from this as both methods have pitfalls and merits and here I am just showing the methods of identifying changing in trend.
Percentage away from high or low.
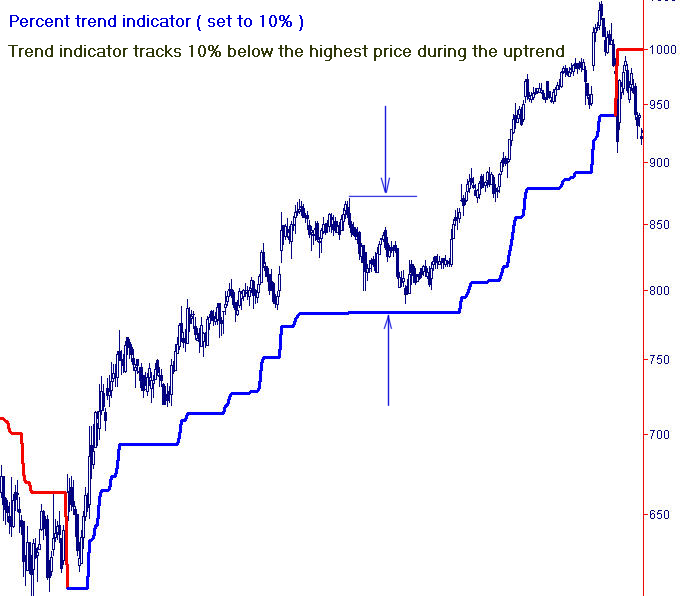
In the diagram above we have a 10% trend model in operation. If you examine the blue-red line you can see it tracks the highest high during the rising trend minus 10% of the high during the trend and does the opposite when the trend is down.
EG on the right side of the picture you can see it went to 1045 and the blue line rose to ( 1045 - 104.5) = 940.5. Once the price fell below 940.5 then trend is classified as down and the line changed colours to become red. This is a very clean and simple method of identifying trends and of course the percentage setting can be altered to suit each market.
The trend percent indicator is available free on request to those scoring more than 1200 in the Trading IQ Game on this site. (must complete all 15 games in a single weekly period to qualify )
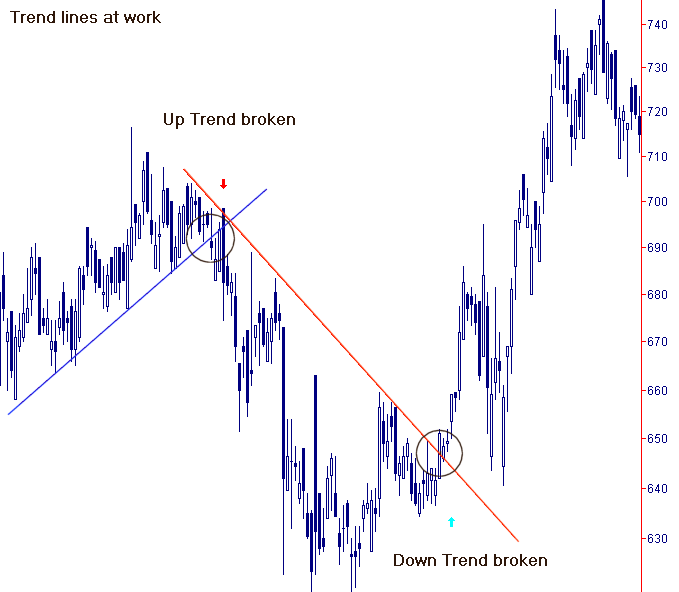
Trend line is breached
In the diagram above we have two clear trend lines. It is important to understand how to draw these lines correctly.
Up-Trend lines are drawn with the line touching a succession of low points ( It is prerequisite that there are least 3 touches)
Down-Trend lines are drawn with the line touching a succession of high points ( It is prerequisite that there are least 3 touches)
Trend lines are something that need to be practiced in order to get them right. Some charts will be very clear and simple to identify where to drawn the lines and others maybe so unclear that it is better not to contemplate drawing line let alone trying to trade them. When you see a clear example it will smack you right in the face as it is so obvious. These examples are the ones to trade, the ones that require no effort to spot.
Proceed to part 3 instrument selection
|
|
If you have a questions then please send me an email |
|
Precision Trading Systems is partnered with MultiCharts and part of the NinjaTrader Ecosystem |
||
|
|
|
|
|
Precision Trading Systems is provider of the following |
Introduction |
|
Precision Trading Systems is partnered with MultiCharts.
Precision Trading Systems is part of the NinjaTrader ecosystem.
Systems and Indicators for Tradestation, NinjaTrader and MultiCharts.
Top quality paid & FREE trading systems and indicators for most platforms
Members can receive some paid products completely FREE
Roger Medcalf is a vendor on the Tradestation App store
Roger Medcalf is a vendor of products of MetaTrader 4
Free to play Trading IQ Game with generous PRIZES from our sponsors.
|
 |
| RISK DISCLOSURE |
|
|
| HYPOTHETICAL PERFORMANCE DISCLOSURE |
|
Hypothetical performance results have many inherent limitations, some of which are described below. no representation is being made that any account will or is likely to achieve profits or losses similar to those shown; in fact, there are frequently sharp differences between hypothetical performance results and the actual results subsequently achieved by any particular trading program. One of the limitations of hypothetical performance results is that they are generally prepared with the benefit of hindsight. In addition, hypothetical trading does not involve financial risk, and no hypothetical trading record can completely account for the impact of financial risk of actual trading. for example, the ability to withstand losses or to adhere to a particular trading program in spite of trading losses are material points which can also adversely affect actual trading results. There are numerous other factors related to the markets in general or to the implementation of any specific trading program which cannot be fully accounted for in the preparation of hypothetical performance results and all which can adversely affect trading results.
|
| Articles & Videos & Calculators Product guide Trading IQ Game with great prizes Support - Home - Site Map - Testimonials |
April 11th 2023