![]()
The lake ratio is a simple to understand ratio for use in measuring performances of trading systems and indeed the trading account of a trader or fund manager. This is based on the equity curve generated by the trader or the system. In recent times it has become more popular as a tool of institutions for use in measuring traders risk profiles v profits. A lot simpler to calculate than sharp or sortino ratios. Simplicity = Beauty You can find out your own personal lake ratio value by trading a few sessions of the Trading IQ Game and then viewing the trade report at the end of the session ( you must be logged in to receive the trade report ) The three main areas which are used to make the measurement calculation are |
|
Growth rate of account |
|
Depth of draw down of that account ( the greater the percentage of draw down the deeper is the water ) |
|
Time that the account is underwater ( the longer the duration of the draw down the wider the water ) |
| The ideal lake ratio which all fund managers
seek to achieve is the improbable 0.00 and the higher the number measured the worse the
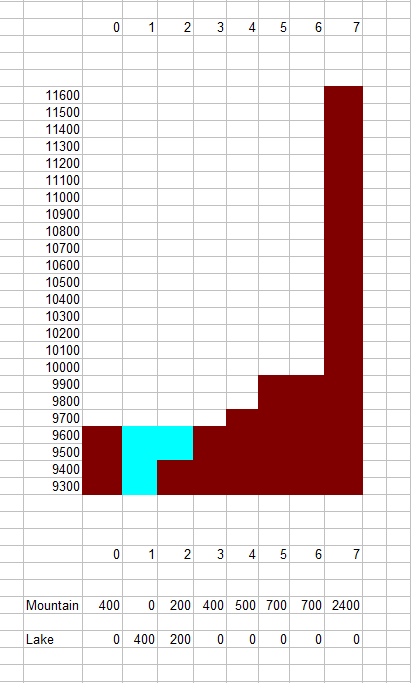
performance. Here are some examples Example No1 In the example below we can see the red area represents the growth of the account and this is referred to as "mountain area" when all the cubes of the mountain area are added up we get 4900 The lake area is counted by adding up the area of the blue area using the right column to note the balance of the account Thus lake area = 600 The to get the lake ratio we simply take the lake volume divided by mountain volume 600 / 4900 Lake ratio = 0.1224 ( very good ) Lake ratio formula = lake divided by mountain. Calculating area of each is best done by sampling each bar or day or which ever frequency of data is used. |
 |
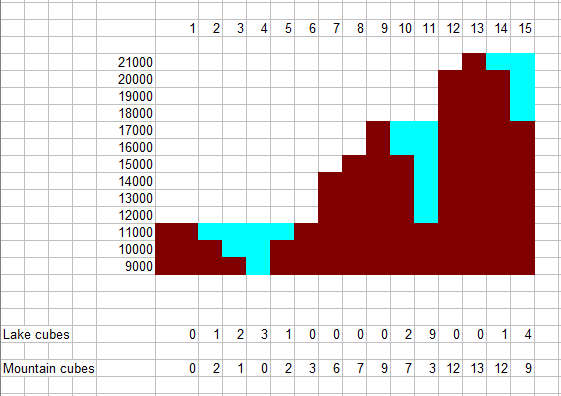
Example No2 In the example below we can see the red area represents the growth of the account and this is referred to as "mountain area" when all the cubes of the mountain area are added up we get Mountain area = 86 The lake area is counted by adding up the area of the blue area using the right column to note the balance of the account Thus lake area = 23 The to get the lake ratio we simply do lake divided by mountain 23 / 86 Lake ratio = 0.2674 ( good ) For calculation purposes the extreme low of the equity curve is taken as the base level for measurment and the extreme peak of the mountain is taken as the high value to measure down from to get the depth of the water. This procedure runs on a bar by bar basis so it the highest peak that has occured "to date" if reading the data from left to right. |
 |
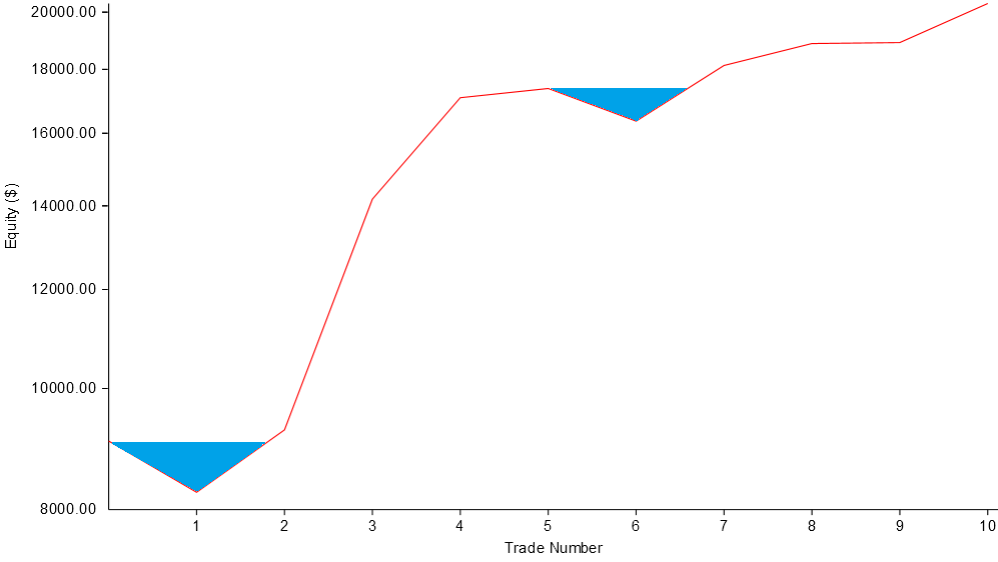
| Example No3 In the example below we can see the actual equity curve of a participant in the Trading IQ Game who achieved an excellent lake ratio of 0.020 which is lower and much better than those above. This metric is used by myself to help me select traders with strong promise and ability to produce good profits with low draw downs and short underwater periods. Those who achieve good results in the Trading IQ Game can be offered my backing by placing funds in their trading accounts and given 25% of any profits they make for me. If you are interested and score a low lake ratio from at least 20 sessions please feel free to read the notes here. Lake ratio = 0.020 ( very very good ) |
 |
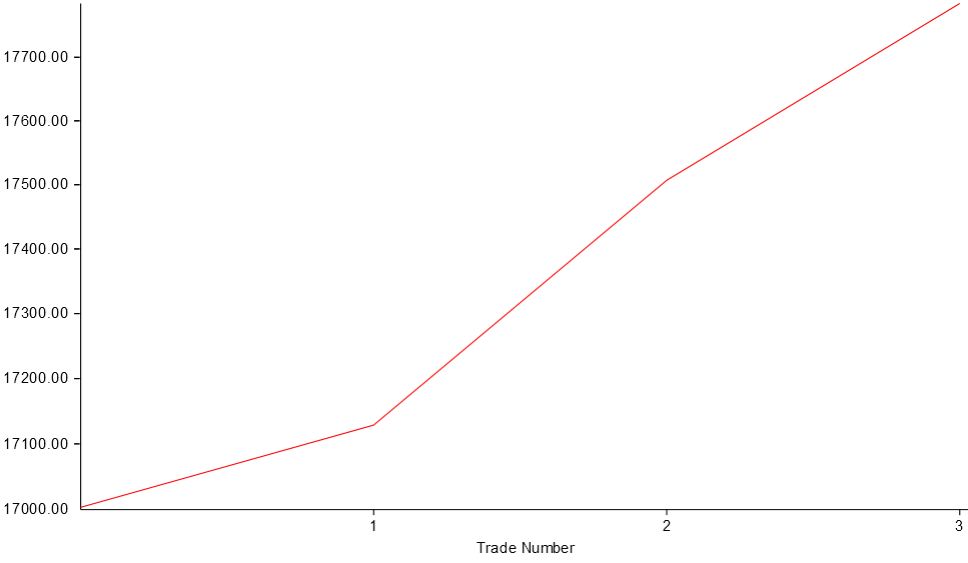
Example No4 In the example below we can see the actual equity curve of a participant in the Trading IQ Game who achieved the dream and got a perfect lake ratio of 0.00 which simply means if you pour water on the equity curve ( mountain ) then it will not settle as their are no lakes for it to collect. This metric is used by myself to help me select traders with high ability to produce good profits with low draw downs and short underwater periods. Obviously there were only four trades to create this chart, and having months of trades without ever registering a losing trade is virtually impossible, but one can understand what fund managers look for when selecting traders to grow their trade accounts up. Lake ratio = 0.00 ( statistically improbable over a long time duration as it requires no losing trades ) |
 |
Learn how to calculate optimum trade sizeLearn about predicting price targets |
|
Precision Trading Systems is partnered with MultiCharts and part of the NinjaTrader Ecosystem |
||
|
|
|
|
|
Precision Trading Systems is provider of the following |
Introduction |
|
Precision Trading Systems is partnered with MultiCharts. Precision Trading Systems is part of the NinjaTrader ecosystem. Systems and Indicators for Tradestation, NinjaTrader and MultiCharts. Top quality paid & FREE trading systems and indicators for most platforms Members can receive some paid products completely FREE Roger Medcalf is a vendor of products of MetaTrader 4 Free to play Trading IQ Game with generous PRIZES from our sponsors.
|
 |
| RISK DISCLOSURE |
|
|
| HYPOTHETICAL PERFORMANCE DISCLOSURE |
|
Hypothetical performance results have many inherent limitations, some of which are described below. no representation is being made that any account will or is likely to achieve profits or losses similar to those shown; in fact, there are frequently sharp differences between hypothetical performance results and the actual results subsequently achieved by any particular trading program. One of the limitations of hypothetical performance results is that they are generally prepared with the benefit of hindsight. In addition, hypothetical trading does not involve financial risk, and no hypothetical trading record can completely account for the impact of financial risk of actual trading. for example, the ability to withstand losses or to adhere to a particular trading program in spite of trading losses are material points which can also adversely affect actual trading results. There are numerous other factors related to the markets in general or to the implementation of any specific trading program which cannot be fully accounted for in the preparation of hypothetical performance results and all which can adversely affect trading results.
|
| Articles & Videos & Calculators Product guide Trading IQ Game with great prizes Support - Home - Site Map - Testimonials |
1