|
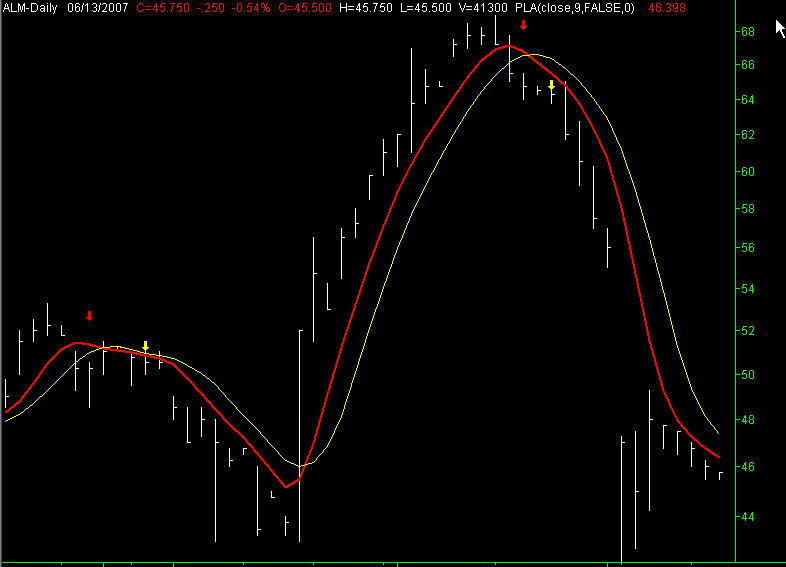
PLA(close,9) (Red line) v Simple moving average(close,9) (Yellow line)
|
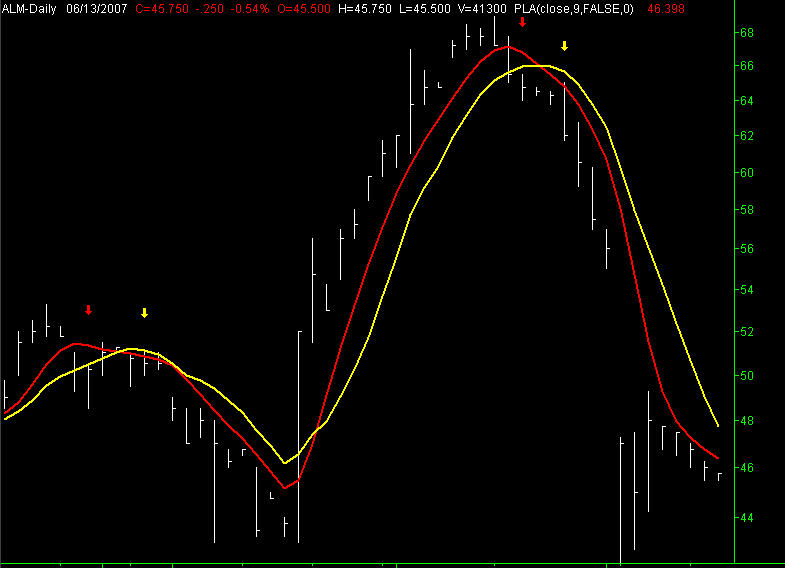 |
| Verdict on 9 period sampling interval
Simple PLA has a lag reduction on the simple average on average of 2.66 bars per trend change and greater accuracy. Signals of each trend change show the following speed improvements. 5 bar improvement on first downtrend, 0 improvement on up trend change, 3 bar improvement on 2nd down trend. PLA clearly stays closer to the price action and signals earlier than the simple average. The PLA Smoothness is also better.
|
|
PLA(close,9) (Red line) v Exponential moving average(close,9) (Yellow line)
|
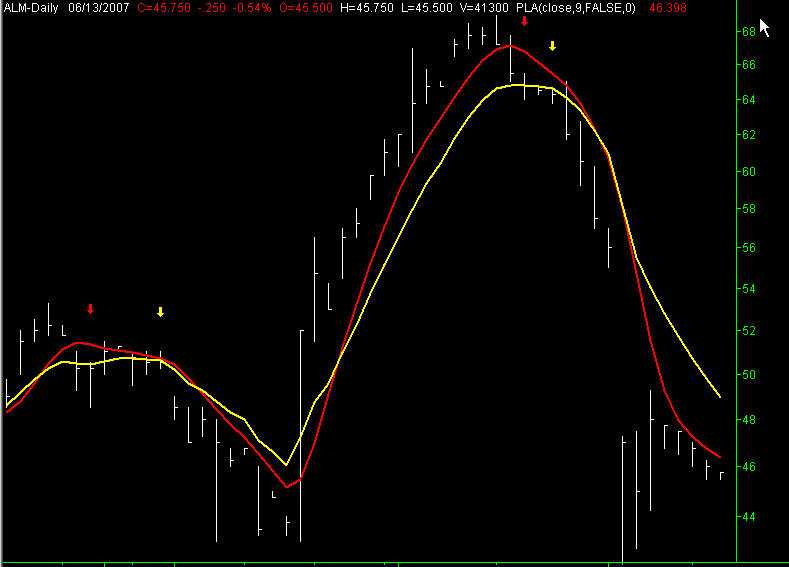 |
| Verdict on 9 period sampling interval
Exponential
PLA has a lag reduction on the Exponential average on average of 3 bars per trend change and greater accuracy. Signals of each trend change show the following speed improvements. 6 bar improvement on first downtrend, 0 improvement on up trend change, 3 bar improvement on 2nd down trend. PLA clearly stays closer to the price action and signals earlier than the Exponential average. Notably the exponential suffers appalling whipsaw and changes several times with no real reason on the left side. The PLA Smoothness is far greater than the exponential.
|
| PLA(close,9) (Red line) v Weighted average(close,9) (Yellow line)
|
 |
| Verdict on 9 period sampling interval
Weighted average
PLA has a lag reduction on the Exponential average on average of 1.33 bars per trend change and greater accuracy, and smoothing. Signals of each trend change show the following speed improvements. 3 bar improvement on first downtrend, 0 improvement on up trend change, 0 bar improvement on 2nd down trend. PLA clearly stays closer to the price action and signals earlier than the Weighted average. Notably the weighted average is faster than the exponential and the simple, but smoothness suffers as a result of speed. More so noticeable in longer periods. The PLA Smoothness is far greater than the weighted.
|
|
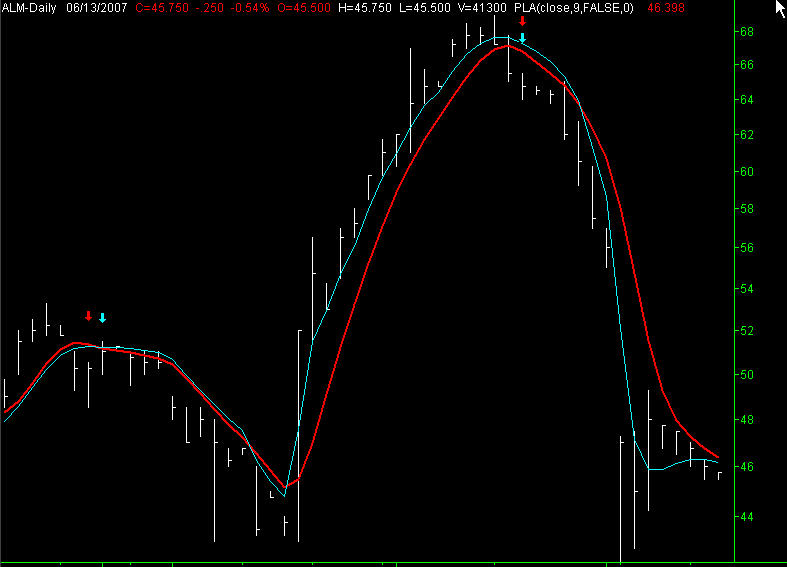
PLA(close,9) (Red line) v Adaptive average (close,9) (Blue line)
|
 |
| Verdict on 9 period sampling interval
Adaptive average
PLA has a lag increase on the Adaptive moving average on average of -1 bars per trend change and greater accuracy. But the adaptive gave 5 extra fake signals of trend change, which effectively renders it un-useable. Signals of each trend change show the following speed improvements. 0 bar improvement on first downtrend, 0 improvement on up trend change, -3 bar improvement on 2nd down trend. PLA clearly stays closer to the price action and signals earlier than the adaptive average. Notably the adaptive average is faster than the PLA but with fake signals, and poor smoothing. The PLA Smoothness is far greater than the adaptive average.
|
|
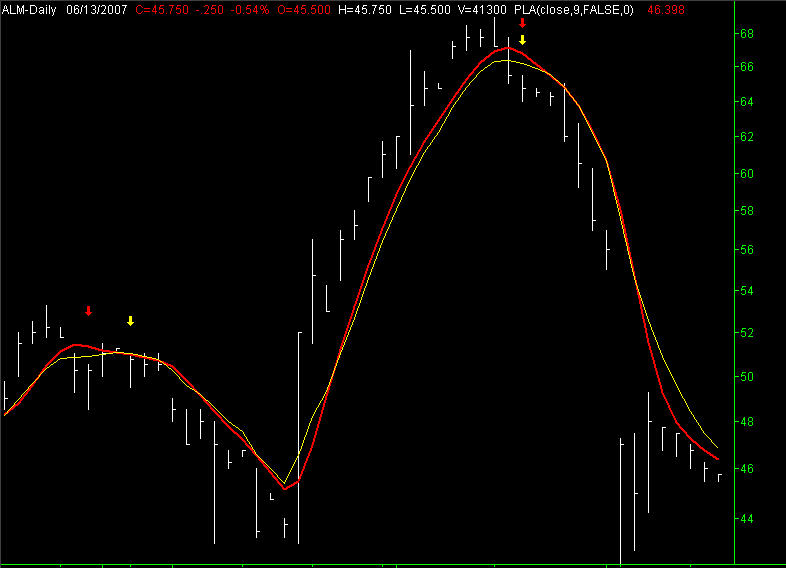
PLA(close,9) (Red line) v Triangular average (close,9) (Yellow line)
|
 |
| Verdict on 9 period sampling interval
Triangular average
PLA has a lag reduction on the Triangular average on average of 2.66 bars per trend change and greater accuracy. Signals of each trend change show the following speed improvements. 4 bar improvement on first downtrend, 1 improvement on up trend change, 3 bar improvement on 2nd down trend. PLA clearly stays closer to the price action and signals earlier than the Triangular average. Notably the Triangular average is has very good smoothing, but low speed. The PLA speed is far greater than the Triangular.
|
|
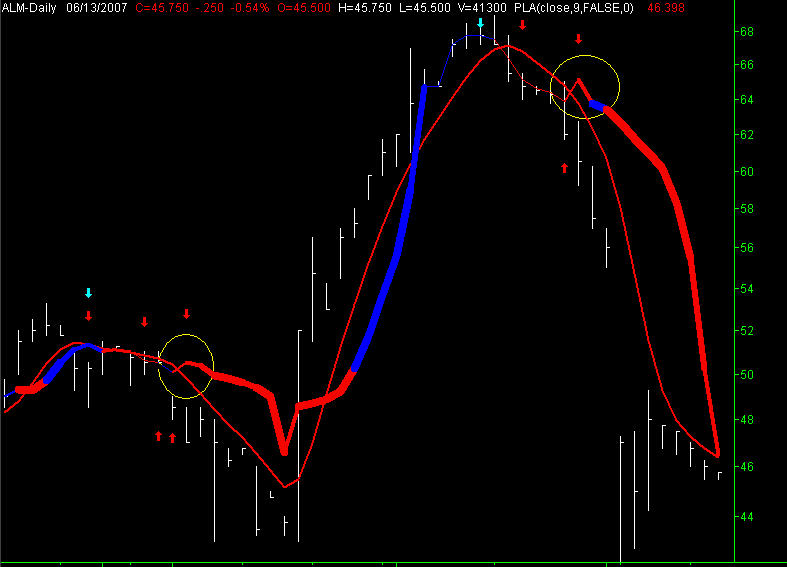
PLA(close,9) (Red line) v Jurikes research JMA (close,9) (Blue line)
|
 |
| Verdict on 9 period sampling interval
JMA average
PLA has a lag reduction on the JMA average on average of 0.33 bars per trend change. Signals of each trend change show the following speed improvements.1 bar improvement on first downtrend, 0 improvement on up trend change, 0 bar improvement on 2nd down trend. Notably the JMA changed direction in the latter data while PLA stayed in short mode. Due to numerous request to compare the PLA with the JMA more screenshots have been provided to show this.
. |
|
This product is now SUPERSEDED BY A NEW VERSION
|