![]()
PRECISION STOP FOR FOR NINJATRADER 8 |
If you require a product for a different platform then please email me and I can possibly provide it.
Looking for a different platform? Please see the Product guide
© Roger Medcalf 2005 - ... You may not reprint text or images without permission
| First and foremost | Thank you very much to the following people from Roger |
|
Precision Trading Systems would like to extend a big thank you to the following people for their patient assistance in helping me convert this product to NinjaTrader 8 script.
Due to the many complexities of this product the conversion from EasyLanguage code to NinjaScript took much longer than expected. Many obstacles were encountered and overcome.
I hope you enjoy using it....
|
Tyler Moore of Mooretech LLC Chelsea Bell of NinjaTrader Matthew Hendricks of NinjaTrader Ray Stein (Formerly of NinjaTrader) |
|
 |
|
Important technical information
System introduction
Advanced features
Check out license prices to purchase
|
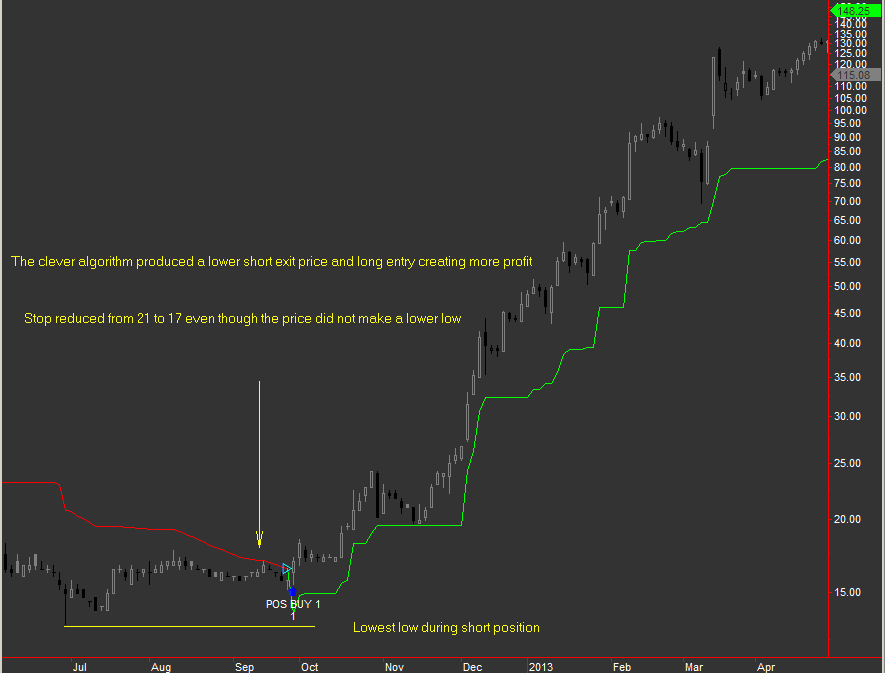
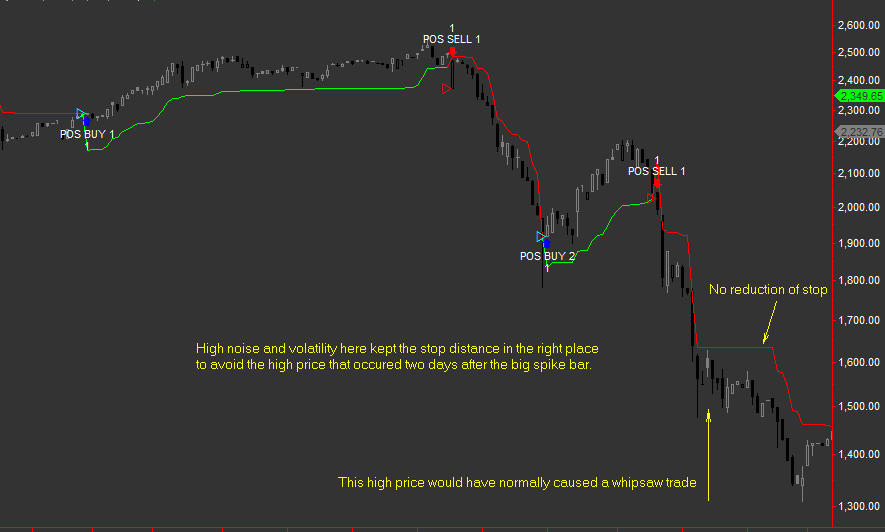
Precision Stop below shows that the stop does not reduce its distance when it is not appropriate to do so. |
 |
|
Protection from Latency is an essential requirement to any model that sends stop loss orders into the market.
Causes of latency in trading systems are due to the actual market data flow being so fast that combined processing time of the internet connection and the speed of the users pc cannot process fast enough to keep up with changes in trend detected by strategies.
EG When a trading system switches from long to short it has a few things to do. First it must exit the long trade, then it would enter a short trade and place a stop loss for that new short.
Do not worry! The Precision Stop strategies have automatic protection from latency.
|
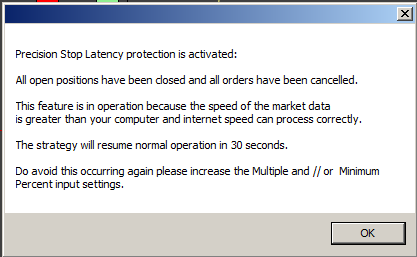
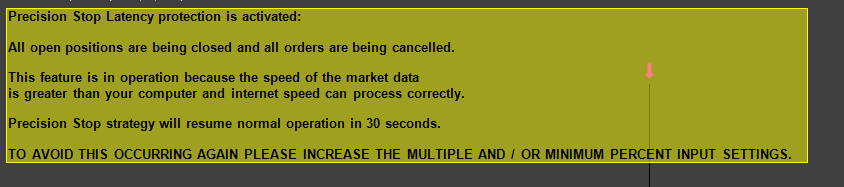
Precision Stop handles Latency in a logical way and protects you from losses
|
 |
|
Latency errors would occur if the stop loss order sent gets rejected by the market because the market price has already moved above it ( thus making the stop order invalid )
Such a scenario would only be experienced using very tight stops on very fast markets and if Precision Stop ever encounters such conditions it will close out any open trades and go flat for 30 seconds. After this period is over the system will resume again. This feature is put in place to protect you from losses which might occur if your pc is slower than those used by professional institutions who are engaged in high frequency trading activity.
Standard features
Technological advancements
Check out license prices to purchase
|
|
Version |
Indicator Forex | Indicator Stocks | Indicator Futures |
Minimum percent
setting
(Minimum setting allowed) |
Multiple setting
(Minimum to Maximum) |
Strategy Latency protection | Strategy Stocks | Strategy Futures |
Strategy Forex |
| GOLD | YES | YES | YES | 0.08 | 0.020 to 5 | YES | YES | YES | NO |
| SILVER | YES | YES | YES | 0.12 | 0.030 to 4 | YES | YES | YES | NO |
| BRONZE | YES | YES | YES | 0.15 | 0.040 to 3 | N-A | NO | NO | NO |
The new Member FORUM is completed
| Precision Stop System Indicator and Function for NinjaTrader 7 | ||||||||||||||||||||||||
|
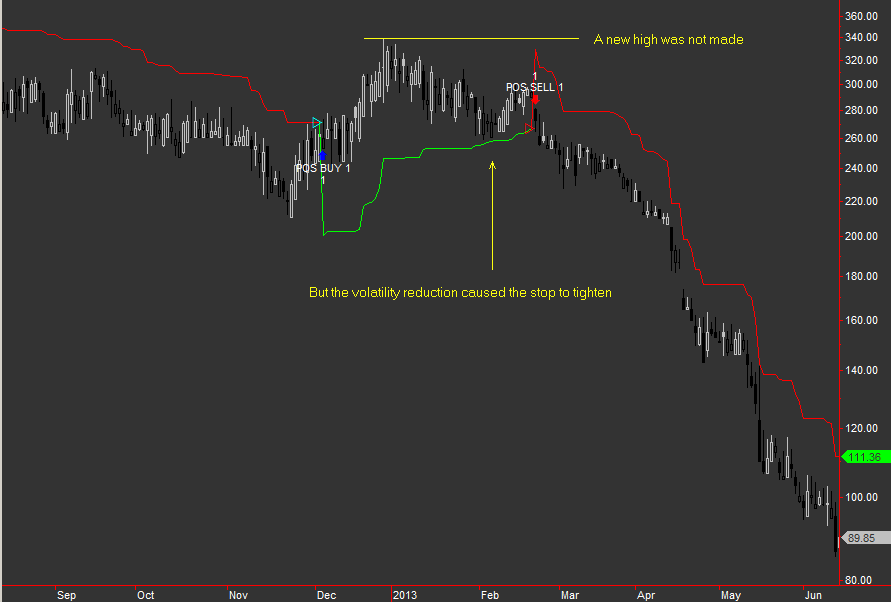
Precision Stop below shows its value. You can observe the high price at 330 produced an initial stop level at 240, however even though no new high was made during the long trade the complex algorithm detected a decrease in volatility and tightened up to 260 resulting in a long exit and short entry 20p better. |
||||||||||||||||||||||||
 |
||||||||||||||||||||||||
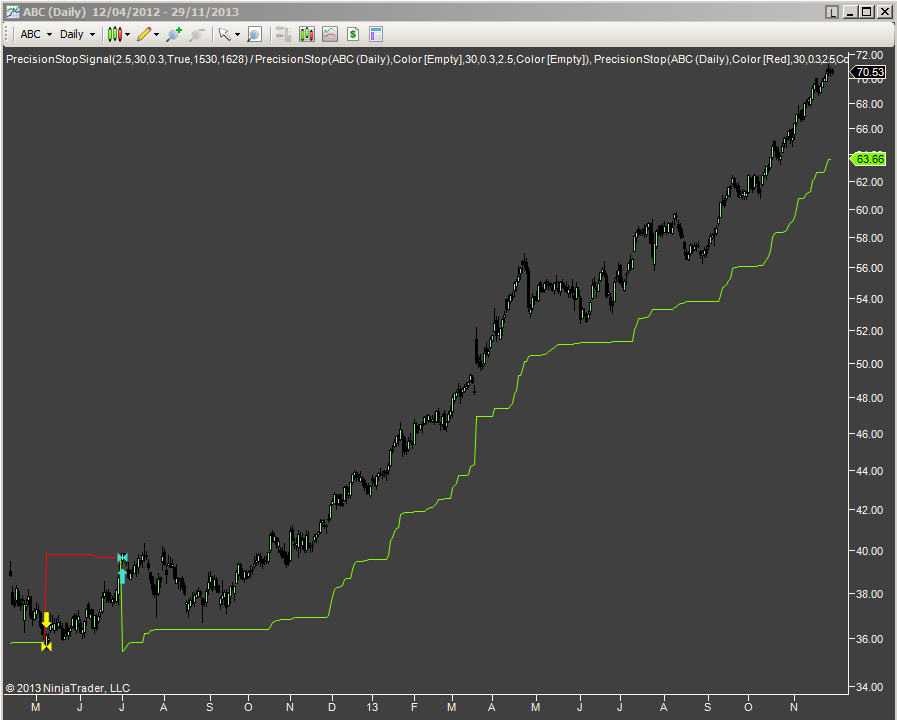
| Precision Stop here on ABC with Multiple set to 2.5 catching a nice move | ||||||||||||||||||||||||
 |
||||||||||||||||||||||||
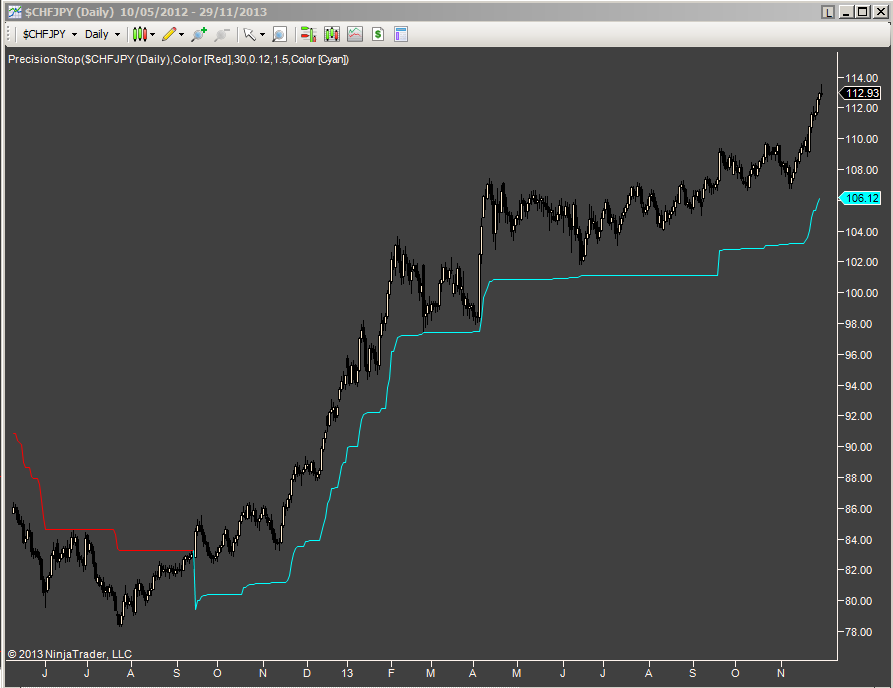
| Precision Stop indicator here showing the indicator on CHFJPY catching a nice trend up from 84 to 112 | ||||||||||||||||||||||||
 |
||||||||||||||||||||||||
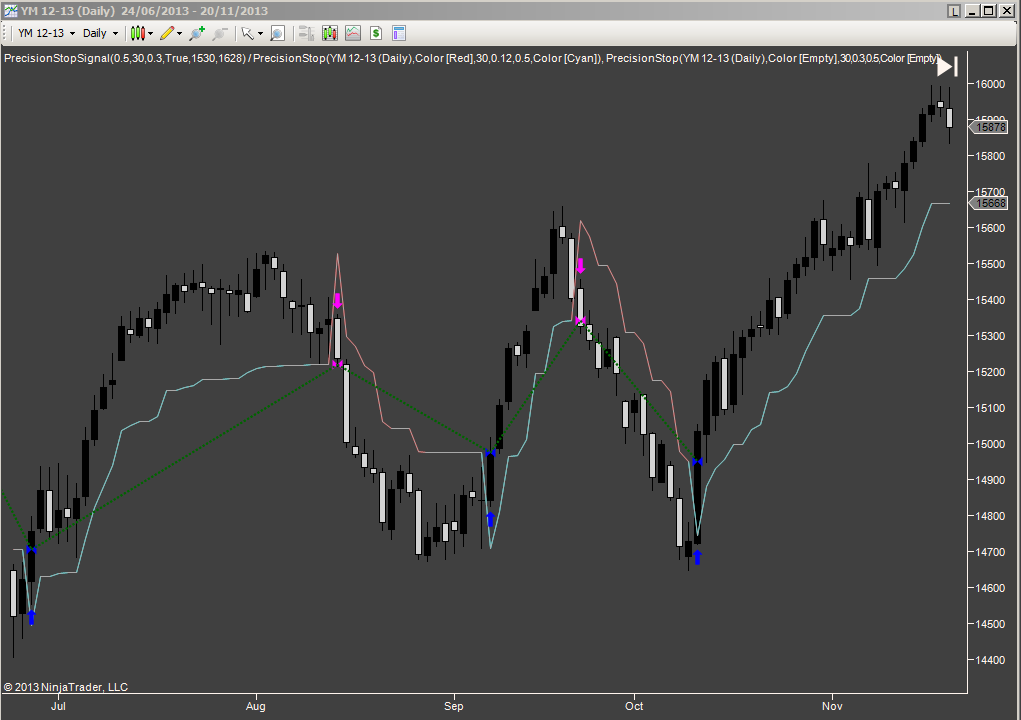
| Precision Stop on YM Dow Jones Industrial average E-mini futures catching the main moves nicely | ||||||||||||||||||||||||
 |
||||||||||||||||||||||||
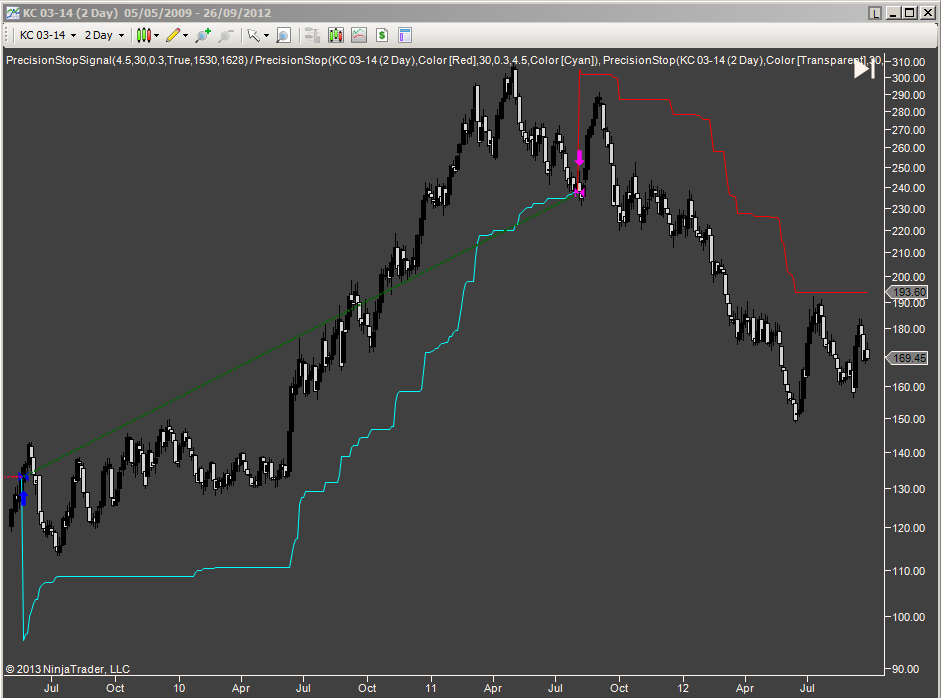
| Precision Stop indicator on Coffee futures | ||||||||||||||||||||||||
 |
||||||||||||||||||||||||
| Precision Stop below shown with Multiple setting of 2 which allows wider stop distances to lock onto the major trends, potentially netting huge returns | ||||||||||||||||||||||||
| User guide for Precision Stop on NinjaTrader7 | ||||||||||||||||||||||||
|
Ordering and purchasing When ordering please include your NinjaTrader machine id number which can be found by opening control centre and then clicking help >> about and its on the 3rd line down To order please click this link and follow the instructions Check out license prices to purchase Installation After you receive the Precision stop file in your email, you need to save it to your pc. After this please then open up Control centre, click on File > Utilites > Import Ninja Script and then select the file from the browse menu in the place you have saved it. After importing it the Precision stop Indicator will appear in the Indicator list and the strategy ( if you purchase gold or silver version ) will appear in the strategy list. Setting up the indicator on a chart. When starting for the first time it is best to attach the indicator first to obtain a visual examination of the approximate settings you want. IMPORTANT Precision Stop ( GOLD, SILVER and BRONZE versions ) are ONLY designed to be used on the following chart types in the NinjaTrader 7 platform. Candlesticks or OHLC Bars in the format of Volume, Tick, Minute, Days, Months Weeks, Volume, Range Renko, Kagi, Point and figure or Line Break charts cannot be used due to the nature of their "in hindsight" processing of real-time information or inability to plot high and low prices accurately on each bar. In strategy back testing of these chart types ( mentioned above in RED font ) can lead to misleading performance results for this product.
Default settings for the indicator. Calculate on bar close = false. This setting is important to leave as false because precision stop detects changes "intra bar" . If a bar opens at 100 and makes a massive move up to 190 in the same bar then retraces back to 185 the precision stop would be able to exit with a great profit. However if the calculate on bar close is set to true, it would not monitor the price action until the bar is closed which could mean that the unrealised profit is never realised. The default setting for Precision stop Multiple is 0.65. Please note this is a general approximation of an effective setting when applied to daily charts and users are encouraged to extensively test many settings before engaging the strategy. The multiple setting is simply a multiplication factor of the distance computed by the Precision stop algorithms. EG If you set this to a large number of 2 or 3 or more it will fit uses on long term daily or weekly charts and if you set it to values smaller than 0.5 it would be more suited to intra-day charts. Each version of Precision Stop GOLD, SILVER and BRONZE versions have minimum and maximum settings for the multiple which you can see on this table below. EG. If plotting a 1 minute chart the PS will get to work and detect the data volatility and produce a value which represents an accurate reflection of market conditions. If the same symbol was then analysed on an hourly chart the outputted value would be much larger. This is because it can view a larger time period of market action the more long term the chart is. You will see that if you use a constant multiple setting on different chart timeframes the distances it creates will be different. This is because if you choose a 10 minute chart the data volatility will be less over the sampling range than it will on a 30 minute chart. You are encouraged to use NinjaTrader optimizer to optimise the time period of the chart to see the change in performance. Multiple settings approximate guidelines for different chart periods
Please note that using this product on very tight settings is likely to use up a lot of commission costs and is not generally recommended unless market conditions are extraordinary. The default setting for Precision stop GOLD Minimum percent is 0.5. This value is used to force Precision stop to be wider that it would perhaps be if a small multiple setting is used. You are encouraged to experiment with many different time frames of chart and different settings to see the power of this product. The default setting for Precision stop Maximum percent is 30%. This setting would mean that if you have very large multiple settings on daily or weekly charts it would force it to be restricted to a maximum of 30% away from the price when the signal is given initially. The maximum allowed setting for max percent is 99.99%. For obvious reasons this is factored in to prevent a value below 0 being displayed on a long trade. Users are advised to thoroughly experiment with these three settings on the indicator to see how it behaves differently. Once you familiarise yourself with these concepts you can then proceed to add the strategy ( for GOLD and SILVER versions ) and try some strategy optimisations in control centre. Strategy user guide continues below.... |
|
Strategy user guide Precision Stop Strategy in NinjaTrader continued... |
| After making an initial visual inspection of the indicator on the chart to find approximate settings you can proceed to do some optimizations. It is critically important to remember not to over optimize and "curve fit" a strategy to a data series as it will be unlikely to be much use in actual trading. How to optimize Precision stop Users In control panel click on file > new > strategy analyzer. A box will open with your instrument list. Click the "O " in between B O W on the top left Left click on the instrument you want to optimize and click optimize. Choose Precision stop from the strategy drop down menu and input the settings you want to test to and from. Expand the box by click on the cross and then type in the min value and max value followed by the increment You can choose the period from day , minute hourly etc and also the date range. Be sure to add commissions to get an accurate test Also you can optimize the data series which is a very good feature of NinjaTrader. ( This feature would test it on charts from 1minute to 20 minute for example and is a very valid procedure to try out ) At the bottom of the panel is "order handling" please select exit on close = false otherwise this will force trades to be closed out at the end of each day and result in over trading and cutting of winners. ( Not as it is designed to be used ) Press the button "Run optimization" at the bottom of the screen On this page is a more in depth method to check a symbol and instrument and strategy combination for robustness. Attaching the Precision Stop Strategy to the chart. After opening a chart window you can right click the screen > strategies and choose Precision Stop (VERSION) from the list. The you can input the settings you observed from the indicator and make sure they are the same. Please set Calculate on bar close to false. Then to enable the strategy click on enabled = true click apply and ok. The strategy will appear on the chart.
|
|
Check out license prices to purchase
|
|
Version |
Indicator Forex | Indicator Stocks | Indicator Futures |
Minimum percent
setting
(Minimum setting allowed) |
Multiple setting
(Minimum to Maximum) |
Strategy Latency protection | Strategy Stocks | Strategy Futures |
Strategy Forex |
| GOLD | YES | YES | YES | 0.08 | 0.020 to 5 | YES | YES | YES | NO |
| SILVER | YES | YES | YES | 0.12 | 0.030 to 4 | YES | YES | YES | NO |
| BRONZE | YES | YES | YES | 0.15 | 0.040 to 3 | N-A | NO | NO | NO |
|
Video showing Precision stop turning £10,000 into £176 million on 70 UK stocks. |
|
When I made this system originally, it was so effective in my initial testing that I could see it was worth putting in a huge amount of effort to establish the best settings for use.
Testing involved re-coding the system in VB.net and creating a stand alone simulation unit which monitored all the important ratios and produced an excel sheet with statistics. This task took many months of work to create, fortunately for you it can be watched in a video of just under 11 minutes long.
For best viewing please choose FULL SCREEN and HD 720 PIXELS or you will not see all the details.
After you watch the video you will see me click on Generate Excel report, this actual report is available to download for your own perusal. The list of 70 stocks used is also available to download If you have trouble viewing all the numbers when watching the video, try moving the slider bar back and forth a few times, the video will then become HD.
|
|
Video explanation and Glossary of terms |
|
| Open position profit | The total profit on all open long and short positions |
| Max Loss | The in running maximum peak to trough draw down possible on a day by day basis assuming all trades get stopped out |
| Risk | The intended risk from entry price to stop on all open positions ( pre-set to 0.25 in the simulation video) |
| RPT (Risk per trade) | Risk divided by Trade divisor, computes the risk of entry price to stop on each individual trade |
| Gearing used | Total value of longs and shorts divided by Working Equity E.G If W Equity = £20,000 and total value = £100,000 Gearing = 5 |
| Highest Gearing | The maximum gearing used during the run |
| % Underwater | The total percentage of time that the equity line is not making a new peak |
| Highest Equity | The highest value of W Equity achieved during the run |
| Net long-short EXP | The value of exposure in the portfolio if net long or short E.G If long value = £10,000 ,short value = £20,000 then net short exp = £10,000 |
| Starting Equity | The initial starting capital used by the run |
| Closed Equity | The profit - loss of all closed out trades + initial capital |
| W Equity | The real time value of the portfolio |
| Risk variable | 0.25 = 25% of the W Equity is used to compute Risk (Adjustments to this value make huge differences to performance) |
| Trades divisor | The number is used to divide Risk variable to allocate correct deal size to each trade. |
| Max cost % per trade | The maximum value of a trade must not exceed this value, this is for limiting huge trades when stop values are tight. (Safety) |
| Initial max trades pd | The maximum number of trades the system will activate on the first day of the run |
| Max trades allowed | The maximum number of trades the system is allowed to have open on any given day |
| Max gearing allowed | The maximum gearing allowed in the run |
| Spread percent | The run uses open high low close data, so bid ask must be estimated. If set to 1.5 then it indicates bid 98.5 ask 100.( 3% a RT ) |
| Noise less than 1000 | Unused filter in the video |
| Percent profit | The real time percentage profit generated during the run. |
| Max draw down | The largest peak to trough value on the run expressed as a percentage. |
| Long W/L ratio | The ratio of number long wins / number long trades (E.G 10 trades 6 wins = 60%) |
| Short W/L ratio | The ratio of number short wins / number short losses |
| Total W/L ratio | Both of the above ratios combined to give a system health reading in one number |
| Long R/Reward | The ratio of average long wins / long losing trades |
| Short R/Reward | The ratio of average short wins / short losing trades |
| Overall R/Reward | The above two ratios combined |
| Pie chart display | Shows the percentage balance of the portfolio in real time during the run. Notice the illusion of a spring pulling it back to long most of the time. |
| Max underwater | The highest period between the account making a new peak. |
| Total long trades | The number of completed long trades during the run |
| Total short trades | The number of completed short trades during the run |
| Total trades | Summation of the two numbers above |
| Long profit | The value of the current open position long profit |
| Short profit | The value of the current open position short profit |
| Display mode | Basic display so as to be easily understood by the average trader |
| Open position P/L | The value of the current open positions profit |
| Locked in profit | The profit value locked in by the stops ( this assumes that the market will trade at the stop level ) See Slippage definition and footnotes |
| Capital employed | The monetary value of all trades basis of their individual entry prices added up |
| Total working | The monetary value of all trades basis of their individual bid ask prices added up |
| Slippage | The amount of slippage applied to each trade. 50% indicates halfway point between the intended stop entry level and the worst price of the day |
| Long cost | The cost of all open long trades when bought |
| Long value | The value of all open long trades in real time |
| Short cost | The cost of all open short trades when sold |
| Short value | The value of all open short trades in real time |
| Indicator generator settings | The settings applied to the Precision stop 2011. Multiplier = the multiplication factor applied, Min percent = minimum percent stop distance |
| The lower windows | Show all the actual trades and their values in running. |
| Generate Excel report | The generate report that goes with this video is available to download directly here on this page |
| Additional clarification information As the test used closing prices for open high low close, it is not possible to extract the bid and ask prices. To get around this accurately there are two separate features added to give a realistic simulation. Spread percent. If the system buys a stock which has a closing price of 100p and the spread percent is set to 1.5 this means it will view the data ask 101.5 and book trades basis of that. The same happens when trades are closed out. So if the trade was opened and closed at the same 100p level it would sell at a price of 98.5p making a total deal cost of 3% per trade. Some stocks in the test have tight spread of less than 0.25% and others are wider up to 5% so this feature averages it out nicely. Slippage factor. This additional feature makes the system testing even more stringent, as it then adds more costs to the equation. E.G if the intended entry price is the above 101.5 and the days high is 105 the simulation will book this trade at (101.5 + 105 ) / 2 making an entry level at 103.2 Software. Please note the VB.net software that generated this video simulation is not for sale to the public as it is my own proprietary software design. Check out license prices to purchase
|
|
|
FAQ for dummies |
|
|
Question:
Which trading system is best for beginners?
Answer:
I have posted the reply in the new member FORUM, and yes you can earn $200 credits to offset against purchases on this site
|
 |
|
Question:
This product is too complicated for me to understand. Have you got a simplified version for the regular average type traders?
Answer:
I am making an asymmetric points and percent model for beginners shortly.
Please see home page for release dates.
|
Albert says
Things should be made as simple as possible, but not simpler.
Albert Einstien.
|
|
Question:
Do you have instructions for the Precision Stop?
Answer:
Yes, just scroll up--------->
|
INSTRUCTIONS are halfway down this page under USER GUIDE |
|
Question:
What does "Max underwater" as shown in the video mean?
Answer:
There is a detailed glossary of terms ( above ) describing the video above which I spent considerable time to type up, so you get a pie ---->
Reading site pages generally helps understanding of how things work |
|
|
Question:
I notice that the strategies do not work on FOREX why is this?
Answer: The reason is because NinjaTrader charts beginning with the prefix $ ( representing FOREX instruments ) chart the bid or ask but not both. Even if "last" is selected it will choose either the bid or the ask to construct the chart. As the strategy would be reading bid or ask data it would be possible to set it up so that the stop line is already inside the spread of the FOREX instrument which would result in confused strategy orders. It is likely there will be a FOREX version released ( possibly with a custom chart type ) in the future if enough people ask me to make it.
|
Precision Stop FOREX....
May get created if enough people ask me for it
|
|
Question:
If I plot Precision stop on daily YM chart I notice that the distance of the stop is still quite wide. How do I reduce the stop distances?
Answer: The solution is to reduce the time frame of the chart to hourly or minutes format and this reduces the range of data precision stop looks at to compute the multiple setting.
|
INSTRUCTIONS... Tend to work best when you read them ( See user guide in the centre of this page ) |
|
Question:
Does Precision Stop indicator work with Kagi, Renko and tick charts?
Answer:
Not kagi, because they way they process information is not suited to this product. Precision stop will work with the chart types in black font ---->> ---->
|
Precision Stop ( GOLD, SILVER and BRONZE versions ) are ONLY designed to be used on the following chart types in the NinjaTrader 7 platform. Candlesticks or OHLC Bars in the format of Volume, Tick, Minute, Days, Months Weeks, Volume, Range IMPORTANT Line charts, Renko, Kagi, Point and figure or Line Break charts cannot be used due to the nature of their "in hindsight" processing of real-time information or inability to plot high and low prices accurately on each bar. In strategy back testing of these chart types mentioned above in RED font can lead to misleading performance results for this product.
|
|
Question:
I wonder if you can tell me the best timeframes to use Precision Stop?
Answer:
As with most systems and indicators reliability of signals is improved with increases in data sampling frequencies.
E.G. A 15 minute chart would tend to give more reliable signals than a 1 minute chart and a daily chart would tend to be more reliable than 4 hourly chart.
Somewhere in all those different time frames is the optimal.
Looking for the holy grail? Its turns out to be a stopwatch ----> |
|
|
Question:
I notice that the Bronze version does not have latency protection, why is this?
Answer: The Bronze version is indicator only, and as the latency protection feature is only required for the strategy it is marked as N-A on the features list. The GOLD and SILVER strategies do have latency protection features as it is used to prevent erroneous orders getting produced during times of extreme high speed market activity. To be clear, none of the indicators for Precision stop versions require latency protection as the do not handle orders and therefore do not require it. |
|
|
Question:
When will Precision Stop for Esignal be released.?
Answer:
Its will be made if enough people ask for it..
|
If you sign up you can be notified by email when this event occurs |
|
Question:
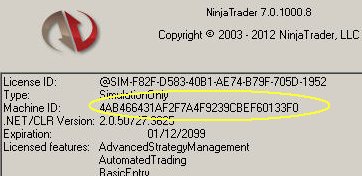
How do I find my NinjaTrader7 machine id details?
Answer: Open NinjaTrader 7 control centre, click on help, about, and your machine id is on the 3rd line. Please copy and paste this into your Paypal order when you purchase.
|
|
|
Question:
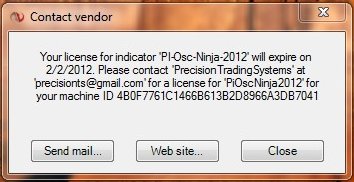
What happens when my license expires? Are there any obligations to me?
Answer: You will get a notification message like this------->
You can renew your license if you wish but do not have to.
|
Nothing bad happens, it just stops working |
Check out license prices to purchase
|
|
|
|
Precision Trading Systems is partnered with MultiCharts and part of the NinjaTrader Ecosystem |
||
|
|
|
|
|
Precision Trading Systems is provider of the following |
Introduction |
|
Precision Trading Systems is partnered with MultiCharts. Precision Trading Systems is part of the NinjaTrader ecosystem. Systems and Indicators for Tradestation, NinjaTrader and MultiCharts. Top quality paid & FREE trading systems and indicators for most platforms Members can receive some paid products completely FREE Roger Medcalf is a vendor of product of MetaTrader 4 Free to play Trading IQ Game with generous PRIZES from our sponsors.
|
 |
| RISK DISCLOSURE |
|
|
| HYPOTHETICAL PERFORMANCE DISCLOSURE |
|
Hypothetical performance results have many inherent limitations, some of which are described below. no representation is being made that any account will or is likely to achieve profits or losses similar to those shown; in fact, there are frequently sharp differences between hypothetical performance results and the actual results subsequently achieved by any particular trading program. One of the limitations of hypothetical performance results is that they are generally prepared with the benefit of hindsight. In addition, hypothetical trading does not involve financial risk, and no hypothetical trading record can completely account for the impact of financial risk of actual trading. for example, the ability to withstand losses or to adhere to a particular trading program in spite of trading losses are material points which can also adversely affect actual trading results. There are numerous other factors related to the markets in general or to the implementation of any specific trading program which cannot be fully accounted for in the preparation of hypothetical performance results and all which can adversely affect trading results.
|
Last update
March 6th 2020 json-ga-sc-async-hypen-vid-og
April 29th 2023 updated payment link and GA code to 4 HTP Old links removed