Provided by Precision Trading Systems for MultiCharts and Tradestation
The many uses of the Volume flow indicator VFI clearly displayed in chart examples
1. When VFI is above zero this denotes a
bullish condition. (Trend definition)
2.
When VFI is below zero this denotes a bearish condition. (Trend
definition)
3. As a divergences
indicator,It can be in the usual way as one would use other oscillators
such as Demand Index or Money Flow MFI and Qstick indicators
4. One use not highlighted by most texts is the
use of "V" formations in VFI which when highly correlated with the price
of flag up the trend turning points
in a timely manner. These observations
are best when a dramatic rise of fall in the price and the VFI precede the
V formation.
5. Topping and bottoming
patterns such as head and shoulders and double tops which form in the VFI
often herald a trend reversal in the underlying
instrument before it shows
in the actual price. Pleas see images below.
6.
Rumour has it that Mr Katsanos made $700,000 in a single day from a signal
generated by the volume flow indicator.
7.
As an overbought or oversold oscillator in the same way as RSI
would be used.
8. IMPORTANT NOTE When an
extreme high reading ( overbought ) is observed on the VFI it can often be
an early warning to herald a major uptrend is
starting and traders
entering short on these readings must exercise extreme caution.
9. Obviously the same applies vice versa when
extreme oversold readings occur.
Designer of the Volume Flow Indicator or VFI

Markos Katsanos: (Genius)
Introduction
Mr Katsanos graduated in structural engineering and holds an honours degree in civil engineering. He is a member of the Technical Securities AnalystsAssociation of San Fransico known as ( TSAAF) He began applying his logical commonsense engineering background to the stock market around 1987.
His superbly designed indicator known as the VFI Volume Flow Indicator, is probably his finest piece of work.
Learn more about the VFI Volume Flow Indicator on Markos Katsanos's website.
This indicator is always
going to be high on my list of essential tools in the traders toolbox.
Versatile in its uses, simple to understand and
more reliable than some other inferior volume indicators.
Example 1: Below VFI Flagged up two nice head and
shoulders bottoms which called the moves up very early.
-
Best Exploding Cryptos to Buy in 2026
-
-
-
-
Example 2: Below VFI crosses zero with conviction,
and forewarned the fast move up which occurred a few bars later

This new product uses Demand Index to project the next 30 bars of price action
Feel free to check the next 30 bars were
projected correctly (even on Etherium and Bitcoin)
Good things can be done
with other volume derived indicators such as
Demand Index which the
Precision Divergence Finder shown in the lower plot
It measures multiple instances of DI lengths
and check for divergences that will issue buy signals.
Trades
get triggered when PS goes into long mode if within "N bars" of
the divergence occuring:
Upper plot is the Precision Stop Indicator
Bespoke combo
strategies made for the requirements of each client - Ask for more
details if you have strategy you want designed.
Volume flow indicator
Volume flow indicator break out
Example 3: Below VFI gave four nice "V" Patterns
which called the trend turning points very precisely
Joke for
newlyweds.

Volume flow indicator as trend indication
Example 4: Below Crossing zero called the trend
well, by staying under zero its kept the traders out of bad trades
Volume flow indicator zero line crossing
Example 5: Below VFI Length 8 with no smoothing
functions nicely as an overbought oversold oscillator in the same context
as an RSI would be used. +5 indicated overbought and -5
indicated oversold in this example.
The Precision Index Oscillator below generates buy and sell signals when bouncing away from Pi (+ or - 3.14)
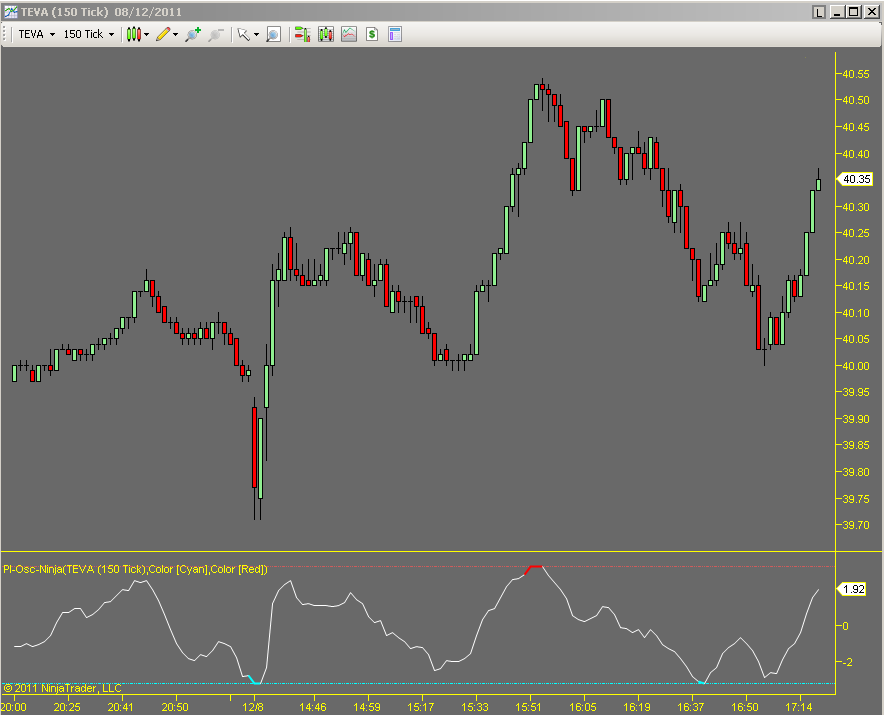
Pi-Osc often finds tops and bottoms with pinpoint accuracy
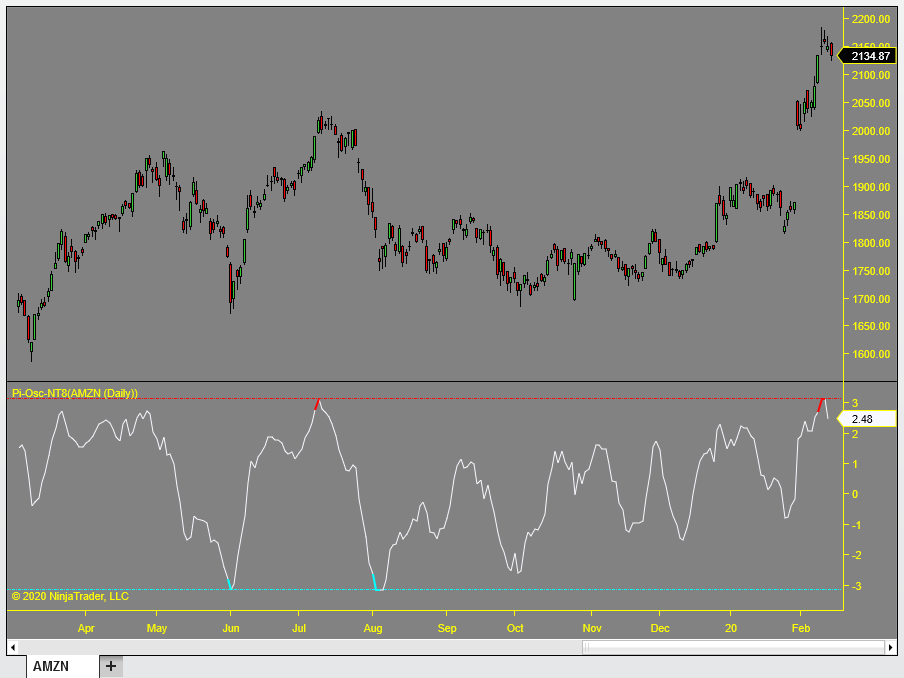
Pi-Osc trials are now available for TradingView learn more
Pi-Osc below shown on Amazon, it also works nicely on crypto currencies.
-
| The little information box full of big information is here - Click on something |
The contact Roger page here also has a site search so you can search the site
|
| Precision Trading Systems Sitemap |
| PTS Home page |
-
The help and advice of customers is valuable to me. Have a suggestion? Send it in!
The contact page here has my email address and you can search the site
PTS Member Login Area
Sign Up for Free PTS Account
About
Precision Trading Systems was founded in 2006 providing high quality indicators and trading systems for a wide range of markets and levels of experience.
Supporting NinjaTrader, Tradestation. MultiCharts, TradingView, MetaTrader 4 and MetaTrader 5
Admin notes
Page updated Dec 26th with "lazy load" images, shop and mobile friendly and new GA4 codes.
Remove shop..fixed html slowly to top...signup link fixed...guest link more desciptive 2026 May 13th
1. Commented out sign up and members FAIL
2. Commented out TO TOP OF PAGE SLOWLY - PASS
3. Re-open sign up and members- PASS
4. re-open back to top (not the slow one) PASS
So the slowly to top is causing lighthouse errors.