![]()
Customer feedback and comments for Precision Trading Systems |
Looking for list of supported platforms? Please see the Product guide
© Roger Medcalf - You may not reprint text or images without permission
|
Read what people are saying about Precision Trading Systems indicators and systems on the Testimonials page These correspondences are in no particular order and are for readers to gain deeper insight into site service etc. Only comments which are relevant to others will be posted
|
|
|
Customer comments.. |
Rogers comments.. |
|
Hi Roger. I am M from Toronto Canada. I have been reading your site recently and some of the concepts you have coded are very similar to my own thinking. Very interesting stuff – I can see a lot of hard work has gone into it. I might be interested in the Mach Trend, but before I consider committing the $995, I was wondering if you could plug the indicator into some of my own data. This to help me see how it works with data I most frequently use. Data is the “CGB” ( Canada Bond Future) daily – and I created a .csv file via from TS 2000i ( Yes! I still use this), at the link below. If you are able to give me a screen shot of the mach trend on the CGB series - with whatever settings you decide on – that would help me greatly to make my decision.
Easy Language programming: I do have really stupid and super small easy language coding needs. These are the kinds of things I think you could do in 15 mins or less. Ex. trying to modify a parabolic function to use it on the plot of a custom oscillator I use. Just on the plot would be good enough. I want to use this plot as an alternative kind of “signal” line. Or – I have an Adaptive Zones TSI type Indicator which is helpful to determine trend stage – and it constantly gets “divide by zero errors” – despite my best amateur efforts to code this out. Need help with that. Anyway as you can see, I am not a programmer. Hope some of this makes sense – please let me know if you are interested and what you might charge. These days my budget is pretty limited, to be clear. Best regards – love your site and ideas –
|
Hi M
Thanks for your interest.
The price of Mach-Trend is high due to the work
involved in creating it, and this is the reason why I offer a demo
version to "get a feel for it" before committing the full payment. I am sure
you can appreciate its not practically possible for me to create custom
screenshots on the data from customers due to time constraints. The demo is
priced at $197 and if the full version is purchased at a later date,
the demo cost is deducted from the full price.
The symbols used on my screenshots are UK stocks
for which the historical data is available free from yahoo or google finance
so comparisons can be made to your own models.
I can solve your division by zero bugs for free
right here, simply ensure that you include this line of code before
divisions.
if value1 = 0 then value1 =
0.0001;
Then you can proceed to divide your number by
value1 and you wont get the error messages, but you have to ask yourself why
you are getting zero values in that variable in the first place, and if it
is a zero then what do you require it to be. Divisions are best avoided in
programming as they use more cpu time, so if you need to divide by 2, the pc
will compute faster if you say x 0.5 instead.
The parabolic signal line I can do for you for
$100 but first please send the exact open code (copy and paste instead of
ELA) of the custom indicator so I can be certain it can be done and of what
you need. Please include a full description of details, inputs needed etc.
Payment is in advance and will be refunded if
the task cannot be completed.
You can pay on the payment pages on the lower
section for private consulting. (One hour minimum)
Hope that helps
Regards
Roger
|
|
Roger That simulation is a nice piece of work, I am suitably impressed. But you don't say when the new version of that system is going to be released? Can you let me know? Cheers E |
Hello E Thanks for the catch, and the positive comments on the simulation video, the new version of precision stop is out in January 2011 |
|
Good Afternoon Roger,
After thinking about our conversation yesterday, I am going to follow through on setting up Precision Oscillator first and then move to Precision Stop, though I would still like to know why you believe the latter is better than the former and why you charge less for the better program?
Thanks,
E
|
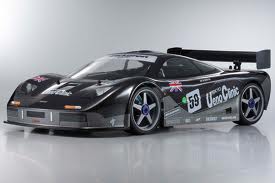
Is the F1 Mclaren better...
than a 4 x 4 Range rover, as it costs so much more?
Would you drive the F1 Mclaren through this landscape?
Precision oscillator will perform better in a choppy - ranging - non trending market... Just as the Precision stop, Mach-Trend or PLA would perform better in a trending market. A Mclaren F1 costs many times more than a 4 x 4 as much more effort went into its production. Supply and demand also effects costing.
|
|
Roger I get this error after installing PLA on an empty EURUSD 5 minute chart per the instructions on your PLA tutorial page. EXCEPTION_INT_DIVIDE_BY_ZERO The attached picture shows what is described below.
I'm quite happy to try any settings you feel may help. Thanks, J (Client had a division by zero error showing in Tradestation, due to my error in sending out the wrong files, remote fixing log is shown in the right column}
|
J,
Please install teamviewer and install the
free version, then send me your session id and password which you can find
in the "wait for session tab"
You can inform me in advance what times are
suitable, as I am here in England and you are in USA.
I can then access your pc and have a look to see
what is happening. You can open up a notepad or word doc so we can type
messages over to each other.
This problem has never occurred before with me
or any of my customers.
Regards
Roger
(Remote pc session log shown below} Rogers comments in red
===Note: Type "eom" when done speaking.===
Somehow the indicator was looking
at the wrong function, I think I must have sent you a bad combination of ELA.
files, just let me test the other one.
hey
|
|
That looks like a $7000.00 trade in 9 days. The
real deal in real time.
Regards, M
|
Thanks for the screenshots, your success with the Pi-osc
and Precision divergence finder are largely due to your patience and
knowledge in knowing how to set them up correctly.
I wish all my customers were as professional as you.
|
|
Here is a remarkable chart of the SPX (S&P 500)
it looks like its getting close to a high.
Regards, M
|
Thanks for the screenshot
|
|
After replying to your email I opened up my TradeStation program and this was the 1st chart that came up. It says it all.
Regards, M Maybe your indicators can breathe some life into those other platforms. I also feel you have discovered the Holy Grail with your Divergence Finder and Precision Index Oscillator. I could send you ten charts a day showing winning signals with your indicators.. Winning trades are there for those that wait. I look forward to all the new updates on your website. Regards, M
Just had to send a couple of photo's of how
fantastic you indicators are. Finially an indicator that is leading not
lagging.
Great on a 150 tick chart and 15 min. chart.
The only thing I had to do was shorten the look
back period to 30 days. When I went back 200 + days it took forever for the
chart to load.
I have checked the signals on both look back
periods and they are the same. I am sure it is because of the high volume
stocks I trade that the lower look back period works.
Thanks also for offering these for the
TradeStation 2000i platform.
From a very satisfied customer.
Regards, M
|
Hello M.
Thanks for your positive comments. Precision
divergence finder has never been a good seller as its too advanced for most
to understand its use. Hence my reluctance to spend time on changing it over
to Ninja trader.
But if its not too much work I will consider it for you.
You are in the top 10% of the "trading
intelligence" level out of my customer base, so you can appreciate the
quality of the work.
Probably you would be amazed that even some of
my fund manager customers don't even grasp the essential points, and they
are looking after millions of dollars worth of other peoples money!
Hope you keep winning, you obviously have the
key elements of patience and discipline.
Regards
Roger
|
|
Hi Roger,
Am a big fan of your new indicator. My knowledge of writing code in
Multicharts is unfortunately limited, is there a way to make a strategy code
when it crosses above/below the zero line? Also, over several days i've
noticed that divergences in the indicator itself can show some good set-ups,
is there a code that can be written to highlight when there's a divergence
between the indicator and price?
Your gravity system looks interesting, let me know when its up and running.
Saw this on the internet that may be of interest to you -
https://carolan.org/indicators/
Thanks again,
P
|
> Thanks for the kind words P, I am glad you are making good use of it. > > Yeah its possible to do that, the zero cross is pretty simple, but the > divergence is more complex. It will also slow down your cpu a bit, > divergences can be 10 bars back or hundreds of bars back, so the code has to > tell it to look at all of the bars, which takes up computing power. > > I can do the zero cross ( signal ) for free, but I suspect its better to > make it dynamic, so you optimise the best crossing points for long and > shorts, so will do it that way. ( crossing above + 1 and below -1 might be > better than zero, but it can be tested to suit your own style, this in > essence will turn it into a trend following "always in the market" model ) > > The divergence part will take me a bit longer. I will look into and get back > to you shortly. > I will have to make a small charge for that part of it. > > The Gravity model could be a long while before its ready. The code is not easy. |
|
Hi Roger,
I'm intrigued by your Lagless Average indicator, I have a couple of
quick questions before I buy the indicator:
1. The chart comparison of PLA and JMA on your web pages shows that PLA
stays locked on the trend while JMA reversed, yet at the same time PLA is
faster than JMA at major turning points, it's commonly understood that you
can't have an indicator that is resistant to minor reversal yet fast
response at the same time, i don't quite understand how it is
possible.... is it done thru self adjusting length?
2. Does PLA indicator stay unchanged once plotted on the chart? ...cos you
know some indicators does hindsight and changes appearances once the trend
or reversal is confirmed.
3. How does the anti-reverse option work? by stopping the moving average
line changing direction until the reversal movement exceeding certain
percent (similar to hindsight)?
Thanks,
K
Hi Roger, thanks very much for the explanation ;-)
I'm very impressed, just curious are you a self taught programmer? Since
the Lagless Average is self adjusting, does it work the same way on all
markets / situations? Cos you know, during your 9 weeks coding, one
can unconsciously curve fit the codes in accordance with a few markets and
be satisfied with the outcome on that particular market or scenario.
yes certainly, you can add my questions to your FAQ section, which will
help other traders as well.
many thanks again,
K
hello Roger, thanks for the Insync Index, I will load it up into my MC. Oh
yes, if you have other freebies, definitely I would like to see them in
action.
I have been testing the PLA last week, I now used it to smooth my other
indicators, i'm very happy about its smoothing capabilities and speed.
I'm also doing some testing on my trailing stop strategy similar to your
Precision Stop strategy.
So how's trading? I hope everything goes well. Once I can test out a
tradable strategy I'll let you know ;-)
K
Hi Roger, thanks again for the addition of the freebies. Let met try them
out.
Regarding my trailing stop indicator, i'm not using it as a stop, instead
I tried to use it as an automated trend following strategy, the exit rule
for the buy side is that if the Close is below the trailing stop, then
exit long positions next bar.
I did some preliminary testing and optimization on the nasdaq emini
index futures (NQ) over the last two months, it seemed to generate steady
profit, however i don't have the continuous historical data for the
symbol, so i can't tell how it will perform over the long run. Such
strategy works best on trendy market, and doesn't work so well on choppy
market such as forex.
The attached screen shot is the equity curve of the strategy.
cheers
K
|
Hello K
Curve fitting is usually the work of criminals
trying to sell things, or of fools who think curve fitting is the correct
route to test indicators and systems.
So no curve fitting here. I am essentially a
trader who dabbles in programming when the mood takes me, or when something
is needed which doesn't already exist.
I have many markets on which to observe the PLA
to check its doing what its supposed to do. Like anything else it works
better on some than others.
But yes, to answer your question its fractal and
effectively filters whatever data is sent into it. As moving averages tend
to lend themselves to trend following systems, it obviously performs best on
markets that trend well. I found a very useful lucky serendipitous discovery
and that was as a tool for smoothing out indicators like demand index or RSI
etc, and having good accurate filtering of these proved very useful.
Yes I taught myself in Easylanguage only but
I don't know .NET or C or any other languages.
It started as a little bit of experimenting, as
somebody was harping on about how good the Hull average was, saying it was
better then JMA which I didn't believe as JMA had been the no1 for many
years.
So I read the Hull code, tried it out, like its
speed, good early signalling of turning points, but didn't like the extreme
overshooting, and extreme inaccuracy.
In one evening I was able to design a better
product than the Hull average and all other basic types. Exponential,
simple, triangular, linear reg, timeseries, etc.
Then I decided to try and improve on the JMA
item, and this improvement proved to be a lot more difficult, eventually it
became an obsession to make the best moving average available, as I
generally do well in any area which I become obsessed with. I didn't think
it would take 9 weeks, but I got there eventually.
Thanks for your permission for adding your
questions to FAQ. You raised some valid points which would help to remove
fears of some sceptics.
If you don't have pay-pal you can pay by check
or bank transfer if you want.
Regards
Roger
|
|
More trouble Roger, I am getting an error in Precision_stop_2009 Tried to
reference back more bars (51) than allowed by current maxbarsback setting
nothing on the screen at all....Thanks R
Morning Roger I finally figured it out. PS was plotting off the screen, after I altered the min limit I found it hiding. Thanks for your help...Can't wait to try it....R |
Please read the instructions R.
Its all there 90 days back it needs
|
|
Thanks, Roger. Yes. Give me a month or so to take a look at the Mach Trend Demo, and then most likely I will be back to purchase the full version. I have a feeling that I'm inclined to trade more towards the 4 period end of things rather than the fixed 50. And, of course, the opportunity to run a genetic optimization is not to be passed over lightly. This is all very different from the way I trade. But highly intriguing, nevertheless. I trade in the classical sense. I first determine if a time series is in a trend mode or in a cycle mode. And then I apply the appropriate mathematical model to trade each segment. The Mach Trend approach appears to look for trends - even if we know they won't always be there - and then to minimize the effects of the resulting whipsaws in the non-trend mode with some sophisticated and clever mathematics. Extraordinary! I'm looking forward to seeing the results of trading this approach. Best wishes, F |
Yes it minimises bad trades by quickly reversing
and holds on to the major trends with its last dying breath......
Your method sounds interesting, similar to John
Ehlers techniques. (Mesa software)
I spent a lot time about 5 years ago working on
such algorithms, but ended up with the realisation that its always better to
bet in the assumption of a trend starting than to try and predict if the
move will be a cycle or a big trend.
|


|
Systems, Indicators and user functions for Tradestation and Multicharts. |
||
|
This collection of user functions and indicators below have been carefully assembled to provide a versatile tool kit for the advanced trader. None of the items below have lots of flashing lights, bells or buttons as you find in the "Holy grail" type worthless advertisements, and all have been carefully chosen because they actually work as trading tools.
Some have been coded by myself while others are the work of some of the best technicians worldwide. I have re-coded most of these into Easy language format. (ELA, ELS)
There are some free items here which you can try out by sending me a mail and specifying which ones you wish to try out. Of course if you require something that is not here I would be very pleased to hear from you.
If you need any indicator, functions or systems coded into Easy Language, Metastock, vb.NET or C# format, then feel free request it.
Request FREE indicators or ask a question
Please sample my free products before buying so you can assess that my programming is reliable, stable and accurate in its execution. Roger © Roger Medcalf 2005 - 2010 ... You may not reprint text or images without permission |
||
| Compatible with.... |
Indicator |
Volume flow indicator (VFI) |
 |
|
Designed by Markos Katsanos this oscillator has many excellent qualities. Useful as a trend confirmation indicator, an overbought oversold oscillator, divergences between the price and the VFI are usually very reliable VFI gets the vote of confidence from Precision trading systems as being a "must have" tool in the discerning traders kit Please click below to see some more detailed examples of charts with the VFI plotted...More details and examples
FREE Stocks, Futures, Bonds, Forex (needs volume to run)
Author: Markos Katsanos. (Open EL code) |
| Compatible with.... | Indicator + function |
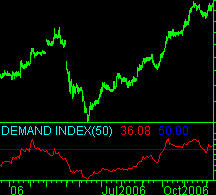
Demand Index |
|
|
|
An excellent oscillator that is versatile in its applications, computing its values from price and volume. It can be used as a divergence indicator and a trend following indicator. I have added a smoothing length feature to suit the needs of the individual user. I find this indicator very useful for observing intra-day price action in actively traded stocks and futures...........More details and examples FREE Stocks, Futures, Bonds, Forex, Indices etc Author: James Sibbet. ( Open EL code )
|
| Compatible with.... | Indicator + function |
Precision Lagless Average |
|
|
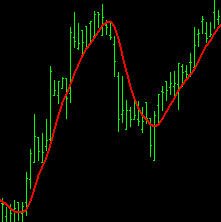 |
A Lagless moving average with no overshoot that outperforms all other known industry standard moving averages. Comes with features including length changing algorithms and an anti-reverse option to minimise over trading in congestion areas, the result of 9 weeks intensive and complex coding after someone told me that the Hull average was better than the Jurikes JMA. In one session I was able to improve on the Hull average, but it took me a lot longer to improve on the Jurik JMA offering.......More details and examples
Price $297 (Pay-Pal) Buy this item Stocks, Futures, Bonds, Forex, Indices etc
Author: Precision Trading Systems. (Protected EL code)
|
| Compatible with.... | Indicator + function + signal |
Precision Stop |
|
|
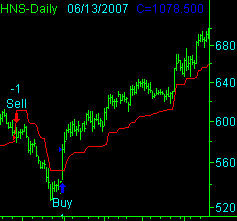 |
Trend following system and indicator that self adjusts its distance to suit noise levels and volatility factors, making it more "intelligent" than Parabolic SAR, or ATR type indicators. Can be adjusted to suit any time frame from day-trading to long term trend following by adjusting MULTI settings, features include a neat max and min percentage distance setting to cater for individual tastes. Takes the guess work out of knowing when the trend is up or down, based on your own input values.......More details and example videos
Price $125 (Pay-Pal) Buy this item Stocks, Futures, Bonds, Forex, Indices etc
Author: Precision Trading Systems. (Protected EL code) |
| Compatible with.... | Indicator + function | Insync Index |
|
|
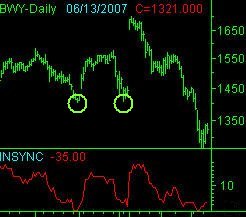 |
A "consensus" oscillator that highlights trend turning points, computing its values from an array of standard oscillators such as RSI Stochastic and Money Flow index. It is best applied to range bound markets rather than trending ones.
I have added a REALVOLUME true-false feature for users who use both tick volume and trade volume..........More details and examples
Stocks, Futures (Unsuitable for Forex)
Author: Norm North. ( Open EL code ) |
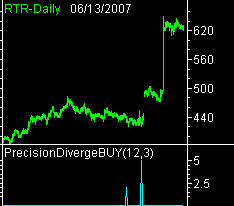
| Compatible with.... | Indicator + function | Precision divergence finder |
|
|
|
A complex piece of code that observes multiple look backs of Demand Index lengths to hunt out when divergences exist. Often produces stunning signals at exact market bottoms. This is not an "always in the market" indicator and only flags up when sets up occur that show a real divergence in a market. As Demand Index uses volume, to perform at its best this indicator needs real volume enabled..............More details and examples
Price $167 (Pay-Pal) Buy this item Stocks, Futures, Bonds (Unsuitable for Forex)
Author: Precision Trading Systems. (Protected EL code) |
| Compatible with.... | Indicator + function | Trade Volume Index ( TVI ) |
|
|
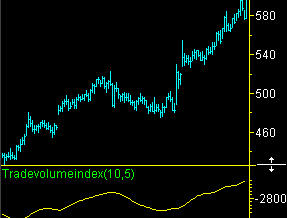 |
Beautiful piece of work by Steve B Achelis, which I used in some of my early systems. Makes for a smooth analysis of volumes flowing in and out of markets and has always been one of my favourites. I have altered the code to allow length changes and smoothing. . Adds the "Volume dimension" to your price analysis in a clear and precise manner. This indicator is a valuable addition to system filters to confirm trend direction...........More
Stocks, Futures, Bonds, Forex, Indices etc
Author: Steve B Achelis. ( Protected EL code) |
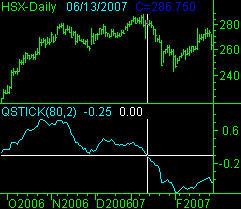
| Compatible with.... | Indicator + function | Q-Stick |
|
|
|
A Simple and yet very efficient way of defining if a trend is in a bull or bear phase. Probably the best piece of work that Chande ever turned out, and yet seemingly forgotten by the whole world. Setting lengths to 80 or more makes for a smooth analysis of trend, and the crossing of zero indicates trend direction.
See how early it signalled a bear move in the example when it crossed zero. Can be used as an short term oscillator with lengths less than 10 and often gives very early signals...More
Stocks, Futures, Bonds, Forex, Indices etc
Author: Tushar Chande. ( Protected EL code) |
| Compatible with.... | Indicator + function | Precision Volume (Tick volume for real-time ) |
|
|
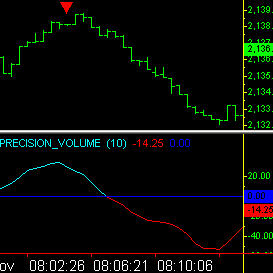 |
An indicator I made for measuring demand-supply imbalances. This indicator will only work correctly if used on real time data with tick volume enabled.
Early warning indicator ( Requires confirmation ) An oscillator type indicator which measures demand and supply imbalances in an easily understood form
Above zero = Demand > Supply over sampling period
New indicator highs or lows over a chosen long length of (100 bars+) often foretell a strong move is coming..........More
Stocks, Futures, non-traded Indices (Unsuitable for Forex)
Author: Precision Trading Systems. (Protected EL code) |
| Compatible with.... | Indicator + function | Precision Index Oscillator ( Pi-Osc ) |
|
|
|
Highly sophisticated "consensus" indicator comprised of many different component signals. A real technicians tool that measures everything from divergences to probabilities to unique chart patterns in a single market indicator. Best results are given when analysing range bound and choppy markets rather than trending ones.
Some of its components use real volume so for this to perform at its best this indicator needs real volume............More
Price $397 (Pay-Pal) Buy this item Stocks, Futures, Bonds
Author: Precision Trading Systems. (Protected EL code) |
| Compatible with.... |
Indicator + function + Signal |
Precision Mach-Trend |
|
|
 |
Designed to reduce whipsaw trades in trending periods and help the user reduce costly F expenses. Mach-Trend is superbly simple to use, and is suitable for all ranges of traders. Calculated using advanced mathematics, this indicator will reduce your F and improve your overall performance. Mach-Trend Platinum pro has fully available parameters enabling advanced optimisations for the sophisticated user.........more information.
Price $995 (Pay-Pal) Buy this item (demo available $197) Stocks, Futures, Bonds, Forex
Author: Precision Trading Systems. (Protected EL code)
|
| Compatible with.... | Indicator + function | Precision Gravity System |
|
|
 |
A complex piece of code that observes multiple phases of planetary orbits, to calculate extreme points of price sets. The relative gravity of the "sun" and "moon" are calculated using advanced physics mathematics. The first system of its kind to be introduced to stock market trading systems, its is still under developments.........more
Stocks, Futures, Bonds (Unsuitable for Forex)
Author: Precision Trading Systems. (Protected EL code) |
| Compatible with.... | Indicator + function |
Money flow index MFI |
|
|
 |
Highly effective volume indicator showing money flowing in and out of securities. Works well as an over bought oversold oscillator and can be used for divergences as well. Ranging between 0 to 100 the MFI crossing above or below 50 can be used to identify a bullish or bearish condition of a trend changing even.....More details and examples
Stocks, Futures, Bonds, Forex, Indices
Author: Unknown. (Open EL code) |
Precision Index Oscillator Site map Contact
| To request a free indicator, drop me an email and I will send it off to you (usually within one hour) |
Home Site
map
Con
tact
Disclaimer
Testimonials appearing on this website may not be representative of
other clients or customers and is not a guarantee of future performance
of success
| RISK DISCLOSURE |
|
|
| HYPOTHETICAL PERFORMANCE DISCLOSURE |
|
Hypothetical performance results have many inherent limitations, some of which are described below. no representation is being made that any account will or is likely to achieve profits or losses similar to those shown; in fact, there are frequently sharp differences between hypothetical performance results and the actual results subsequently achieved by any particular trading program. One of the limitations of hypothetical performance results is that they are generally prepared with the benefit of hindsight. In addition, hypothetical trading does not involve financial risk, and no hypothetical trading record can completely account for the impact of financial risk of actual trading. for example, the ability to withstand losses or to adhere to a particular trading program in spite of trading losses are material points which can also adversely affect actual trading results. There are numerous other factors related to the markets in general or to the implementation of any specific trading program which cannot be fully accounted for in the preparation of hypothetical performance results and all which can adversely affect trading results.
|
March 1st 2020 updated
May 22nd 2023 htp removed type in link